Distribution Analysis
Distribution analysis provides data decomposition capability after dimension metricization. It divides original dimensions into numeric intervals and analyzes the distribution in each interval. Common scenarios include:
- Analyzing order amount distribution
- Analyzing time-period distribution of special events
- Analyzing occurrence count distribution of special events
- Analyzing user age distribution for events
Distribution analysis mainly targets numeric and date attributes such as amount, age, time, and frequency. When uploaded data includes these attribute types, distribution analysis may be used for specific problems.
Create Distribution Analysis
Go to Analysis Center - Distribution Analysis, and click Create.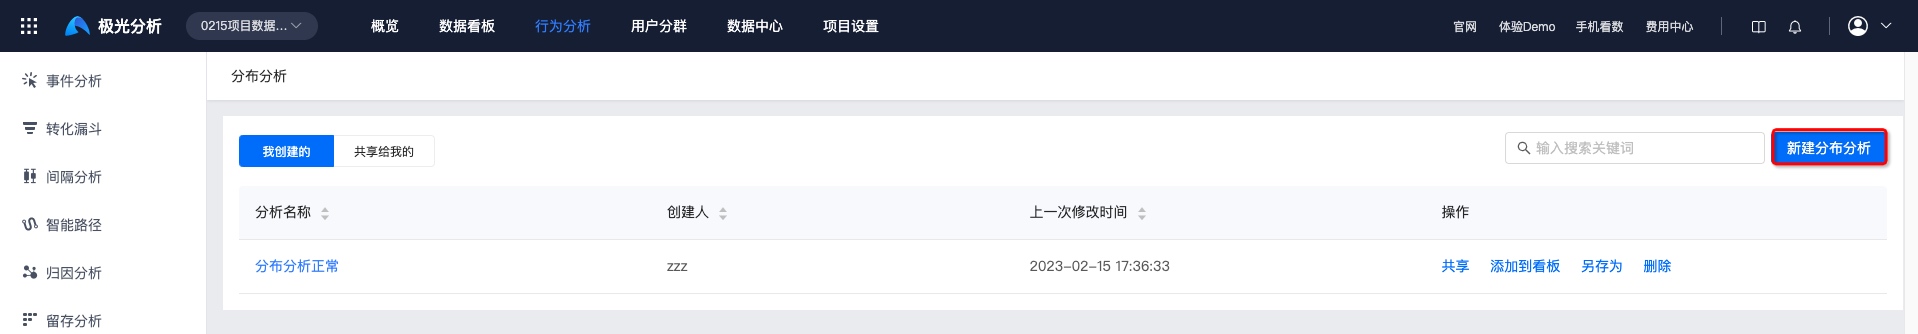
Set Metrics
- Click Any event to add the event to analyze.
Meta events, virtual events, and composite events with reported data appear in the event list.
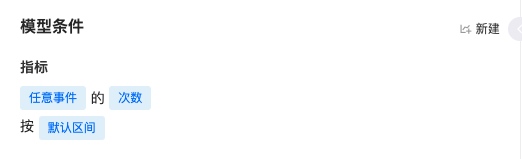
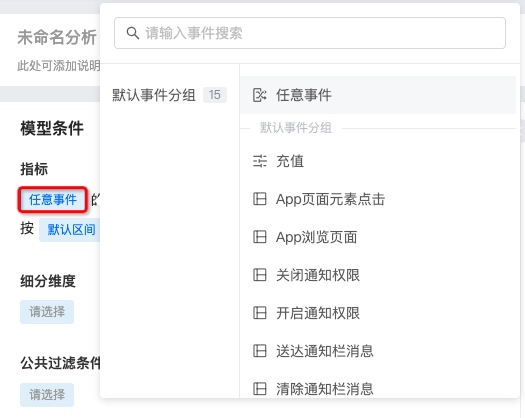
2. Select event metrics such as event count and user count.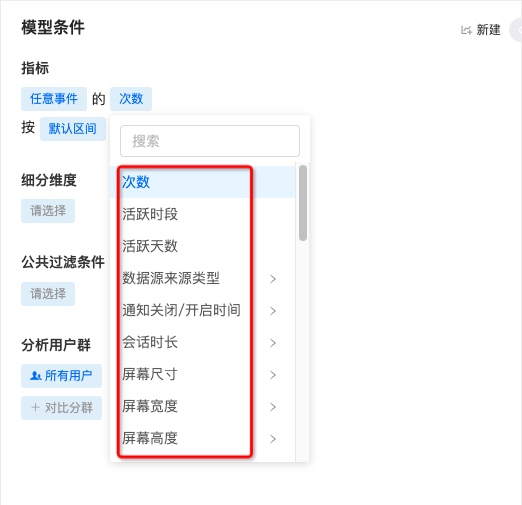
3. Default intervals and custom intervals are supported. Custom intervals require range settings and support multiple intervals.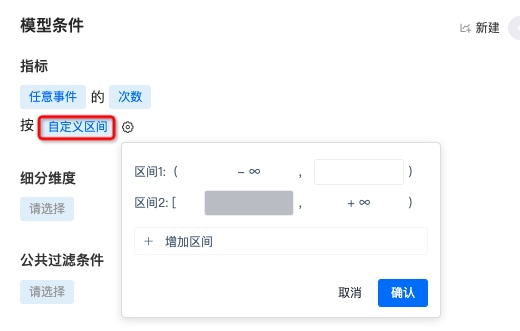
Select Breakdown Dimensions
Multiple dimensions are supported for finer analysis. Dimensions are angles for analyzing data. Event attributes and user attributes can be selected. Example: with city dimension, view app launch count distribution by city.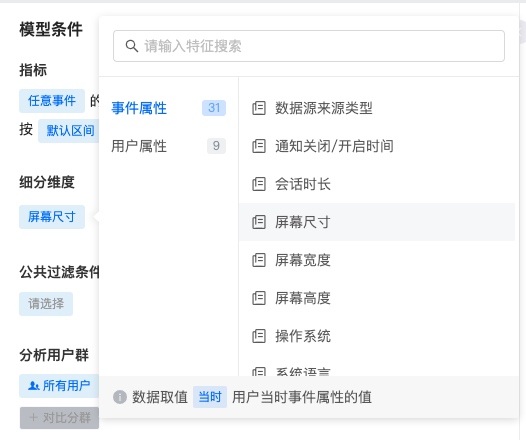
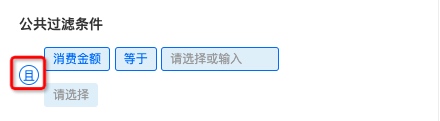
Set Global Filter Conditions
Global filter conditions can constrain multiple metrics. Conditions follow attribute - operator - attribute value. Attributes include event attributes and user attributes. Example: filter platform as Android to view launch count distribution for Android users only.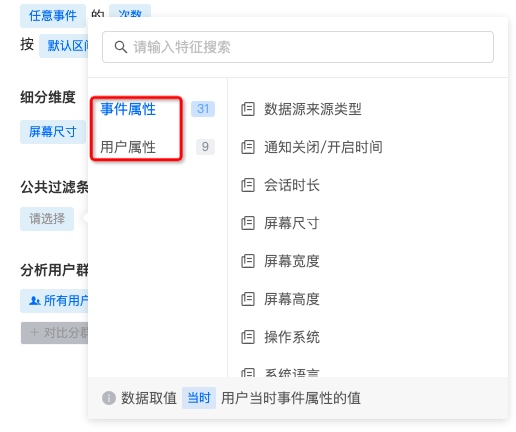
- Multiple filter conditions are supported. Default is intersection. Click And to switch intersection/union.
Select Comparison Segments
Multi-segment comparison is supported. Example: compare launch count distribution between registered and anonymous users in a time range.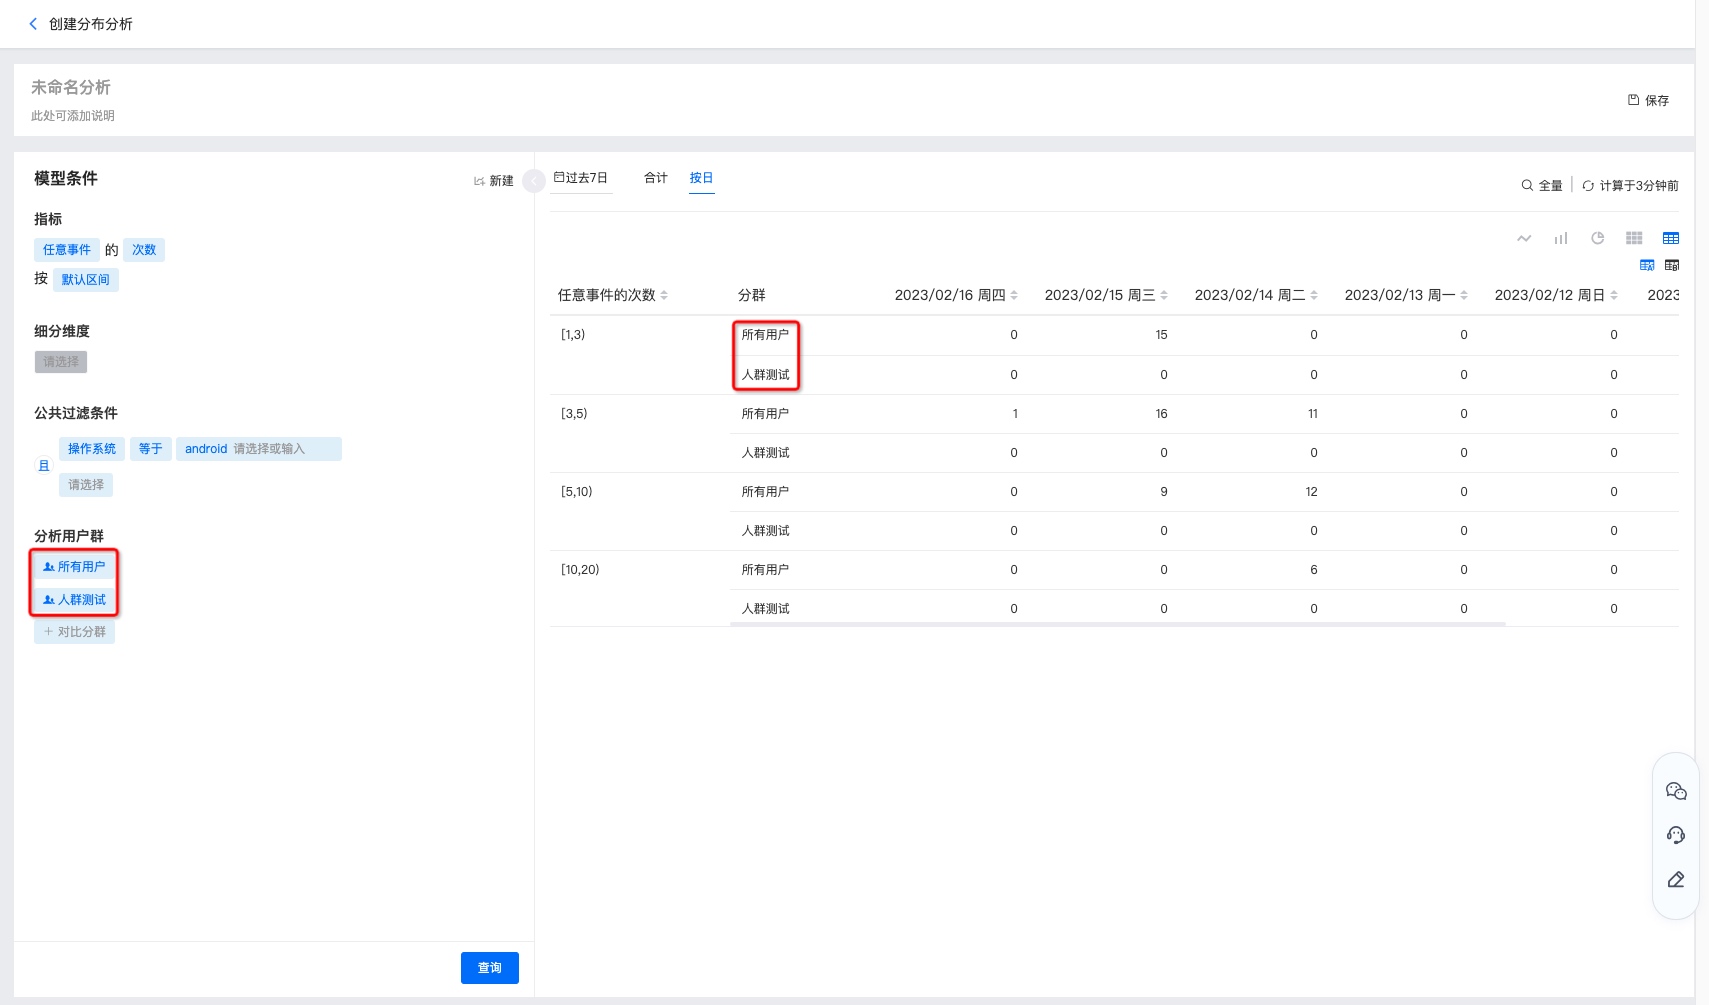
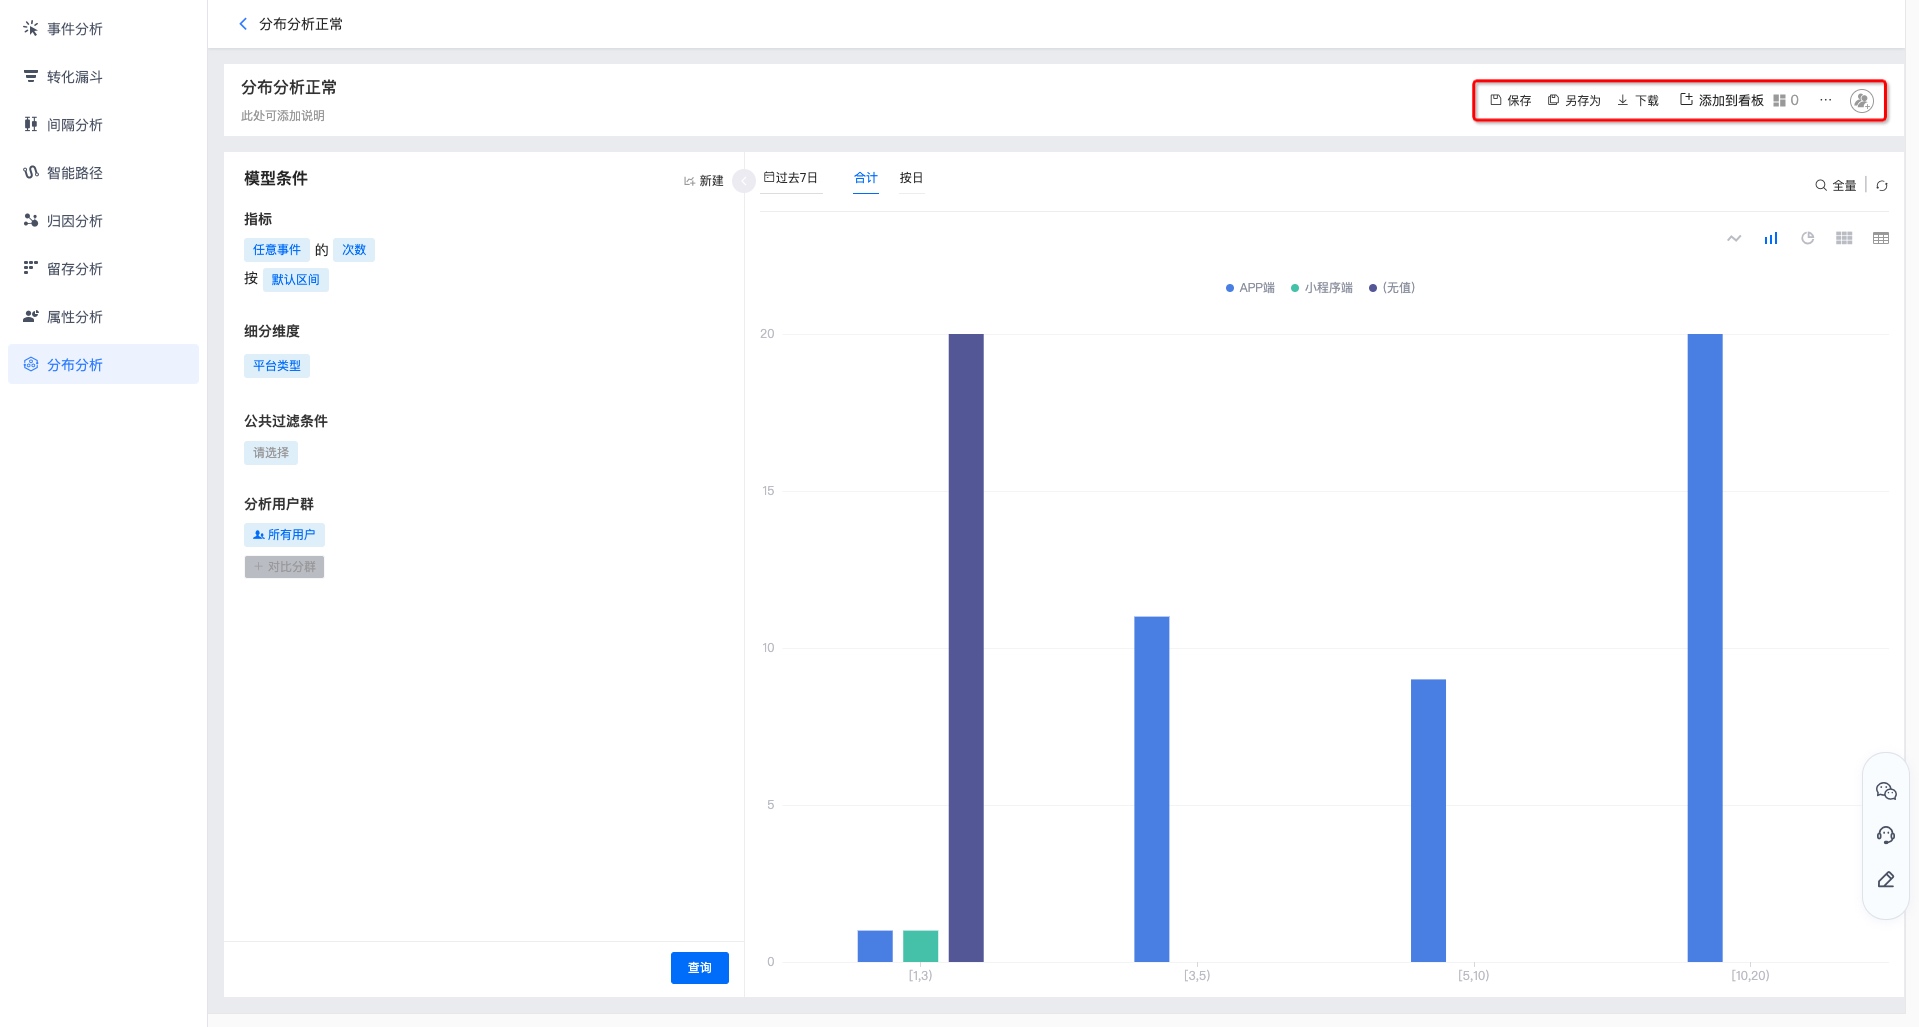
Configure Chart Display
After setting event metrics, click Query to view the chart.
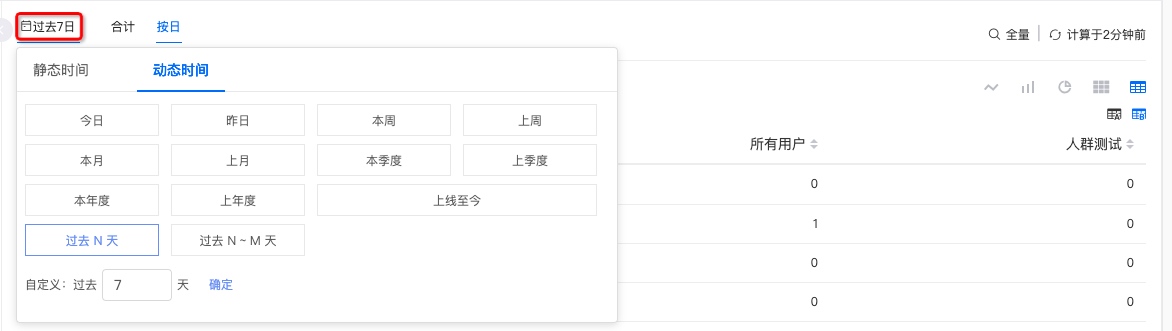
Select Time Range
- Choose common ranges such as last 30 days, today, or last week, or customize start and end time on the right.
- When relative time is saved, queries show dynamic time ranges later. Example: on March 16, selecting last 7 days shows March 9–15; on March 21, the saved chart shows March 14–20.
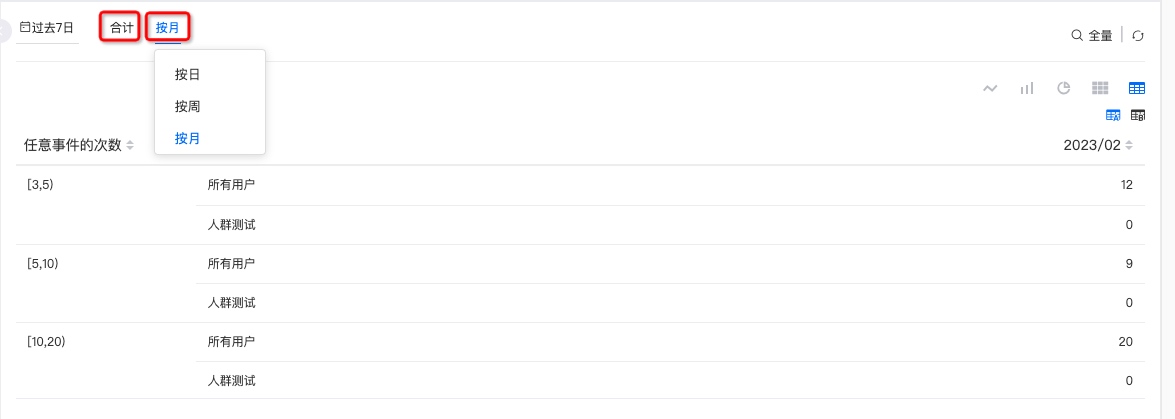
Time Granularity
- Analyze aggregated data over a period, or view trends by day, week, or month.
Set Sampling Ratio
Sampling ratio can be configured as follows: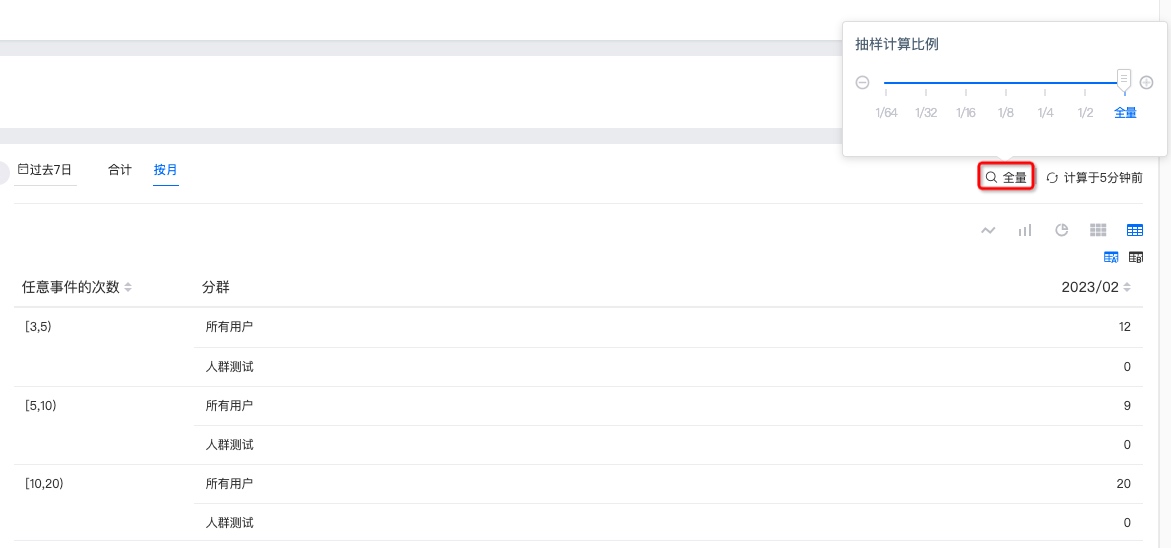
Force Refresh
Last refresh time is shown in the upper right. Click to force refresh for current data.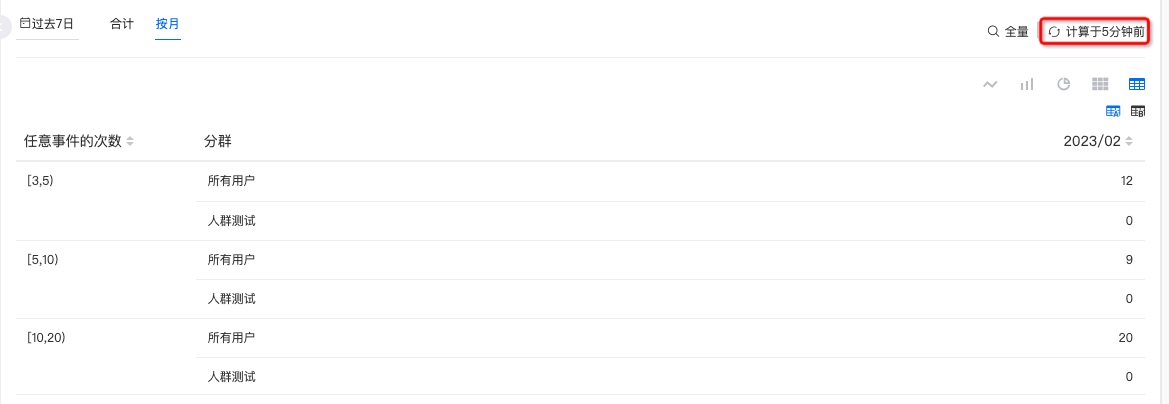
Chart Styles
Results for different metric, condition, audience, and dimension combinations can be shown as line charts, bar charts, pie charts, heat maps, data tables, and more.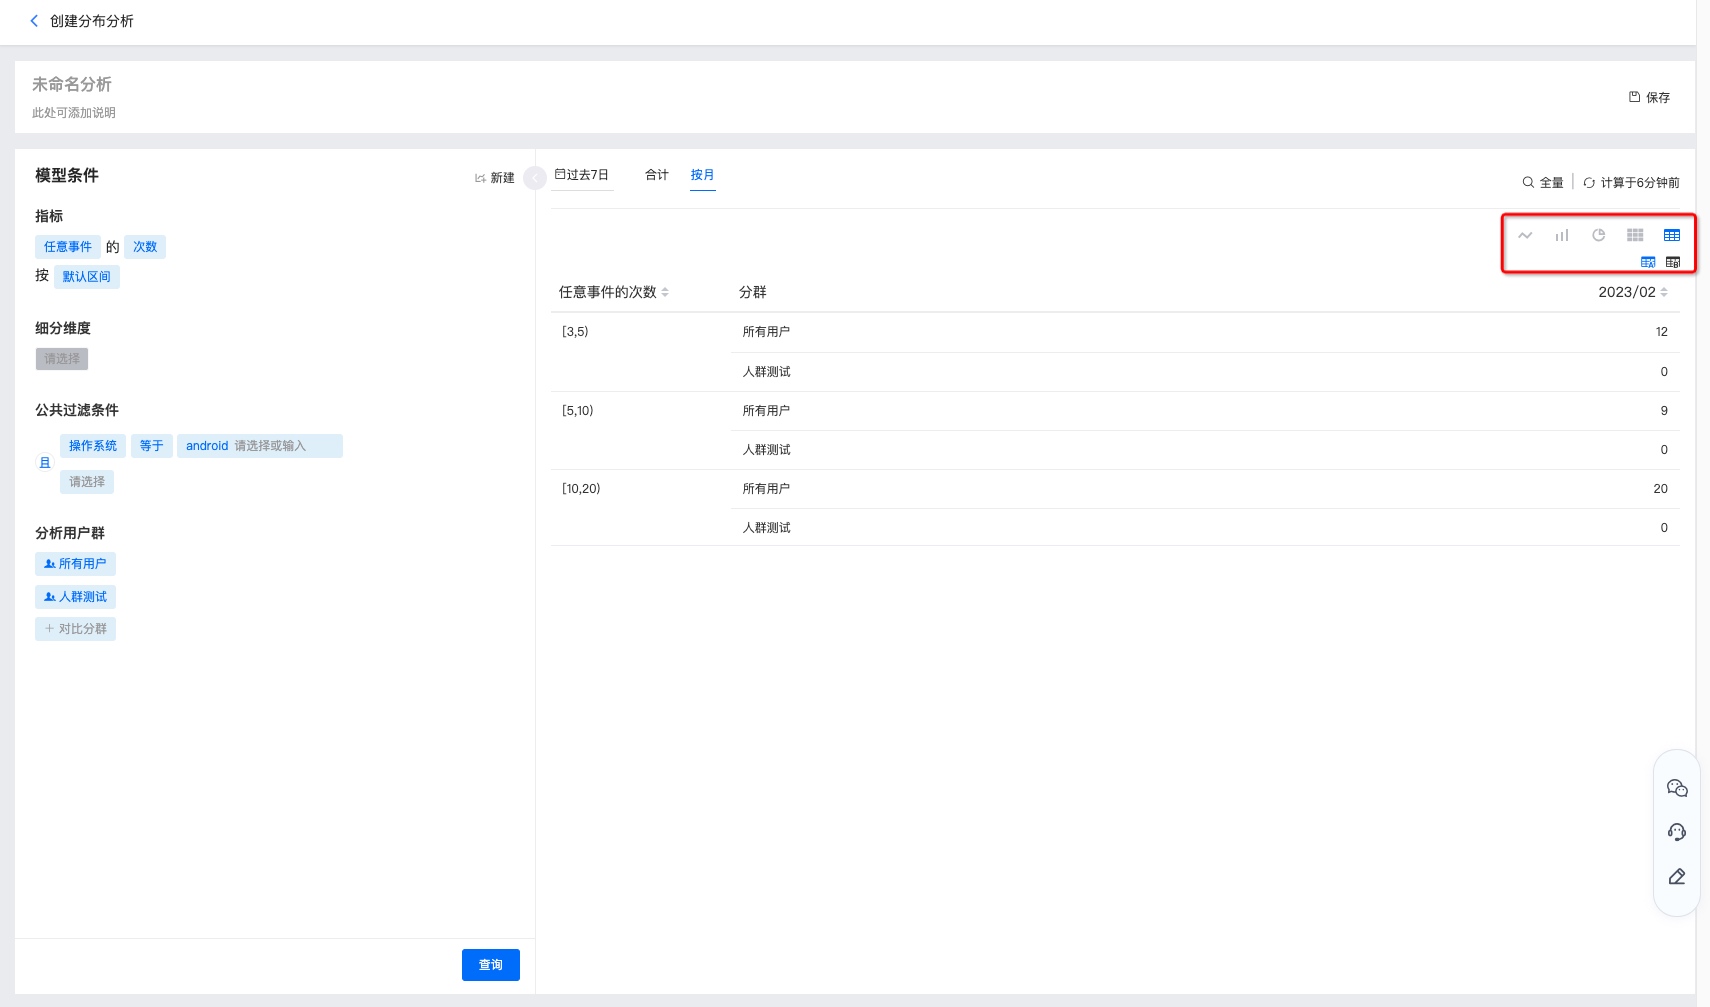
Save Distribution Analysis
Click Save in the upper right, fill in chart name and description, then view it on the distribution analysis home page.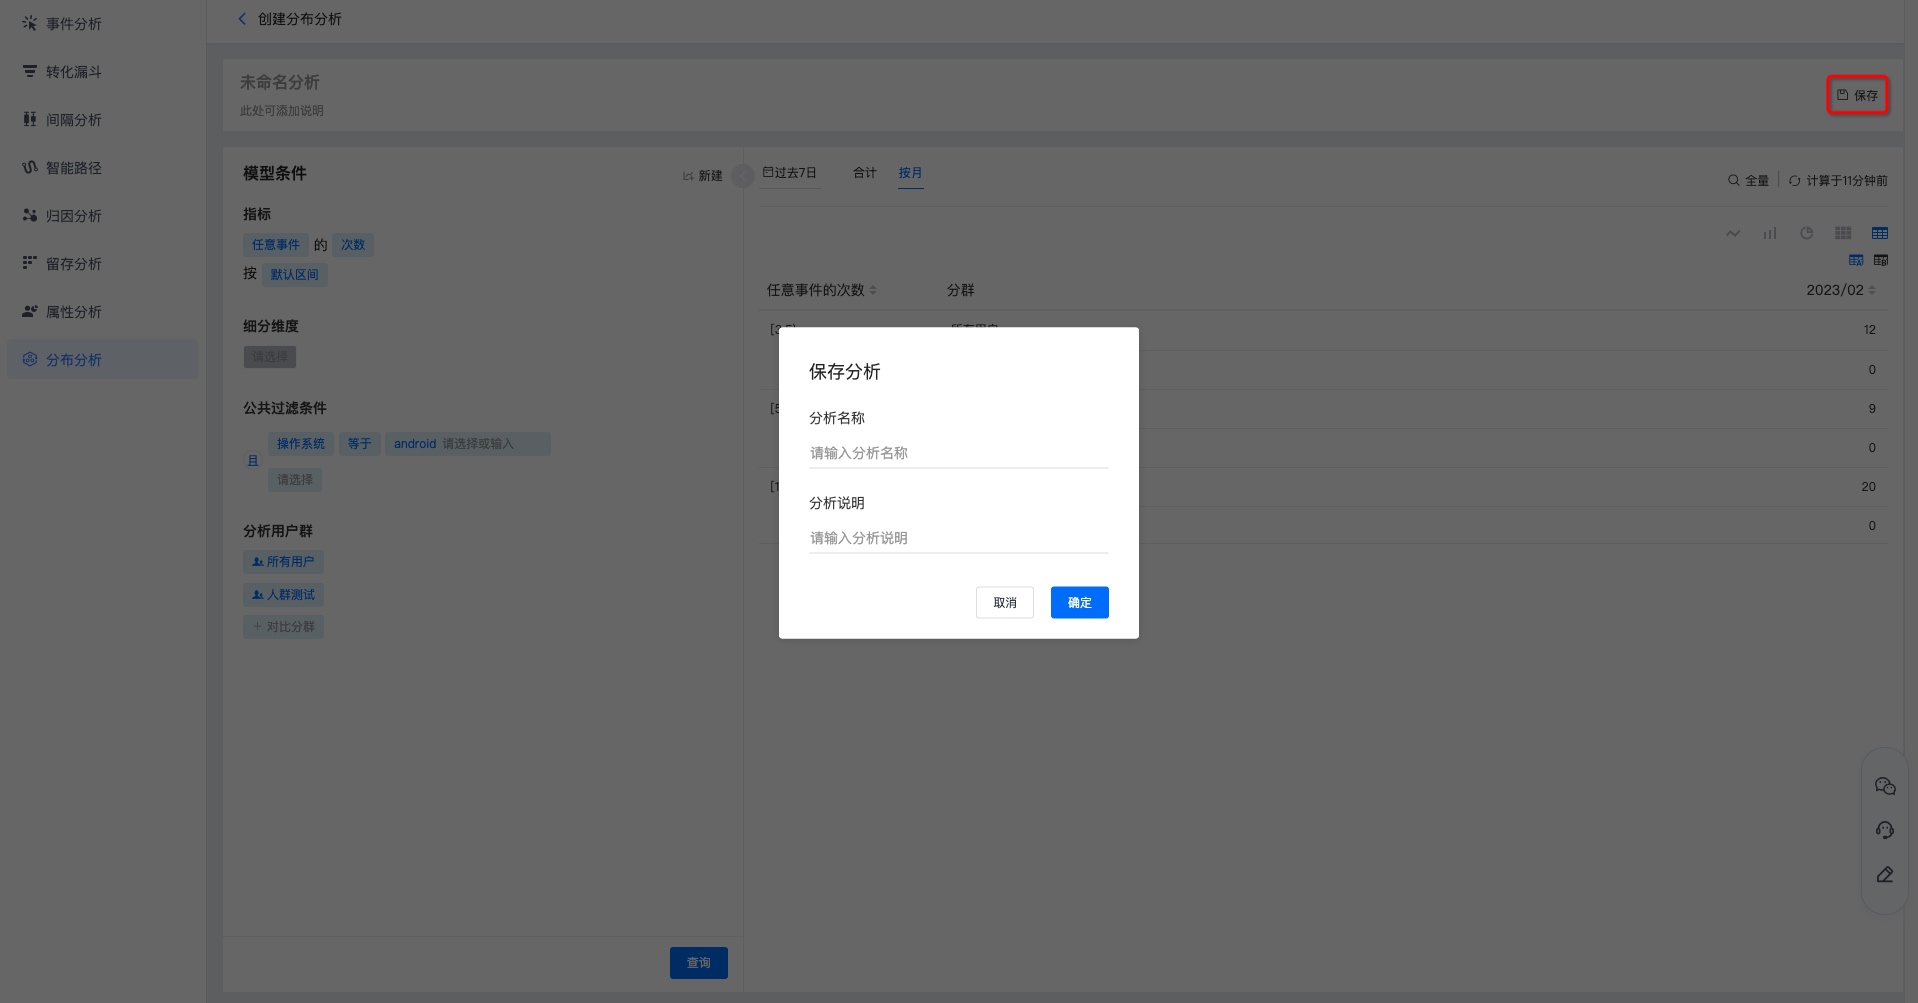
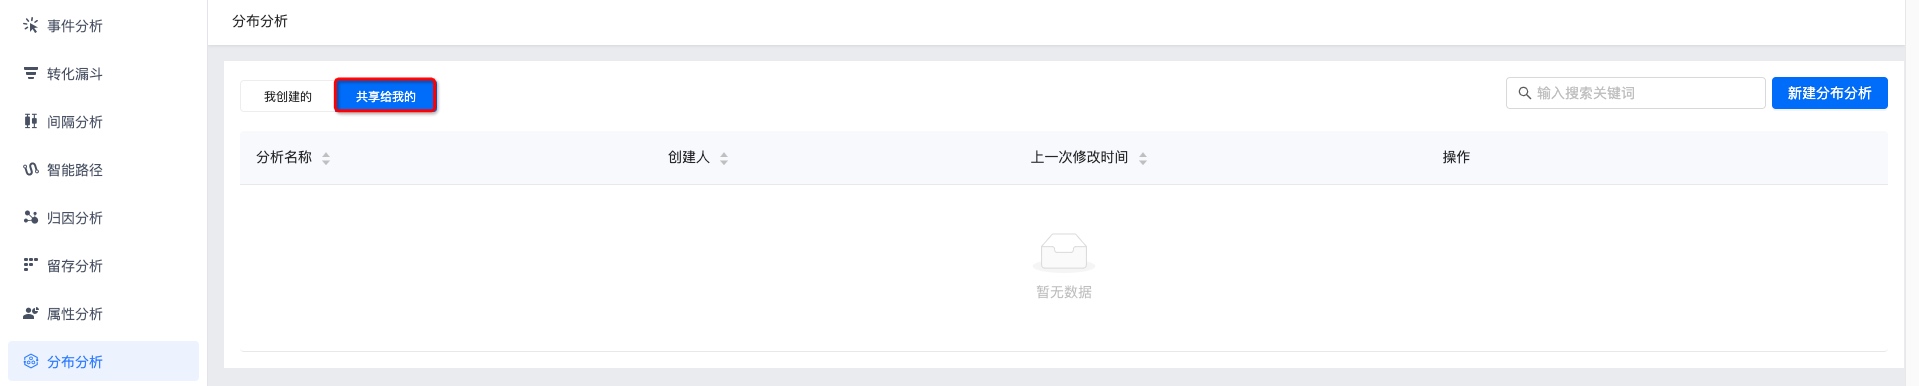
View Distribution Analysis
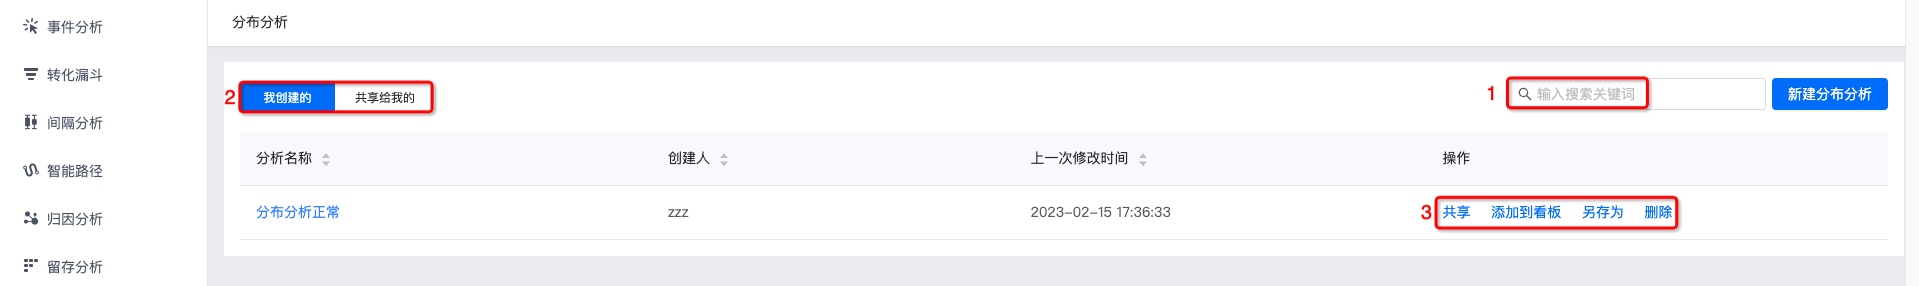
View analyses under Created by me and Shared with me. Click the name to view results.
Search by name in the search box.
Share, add to dashboard, save as copy, and delete. See Distribution Analysis Management.
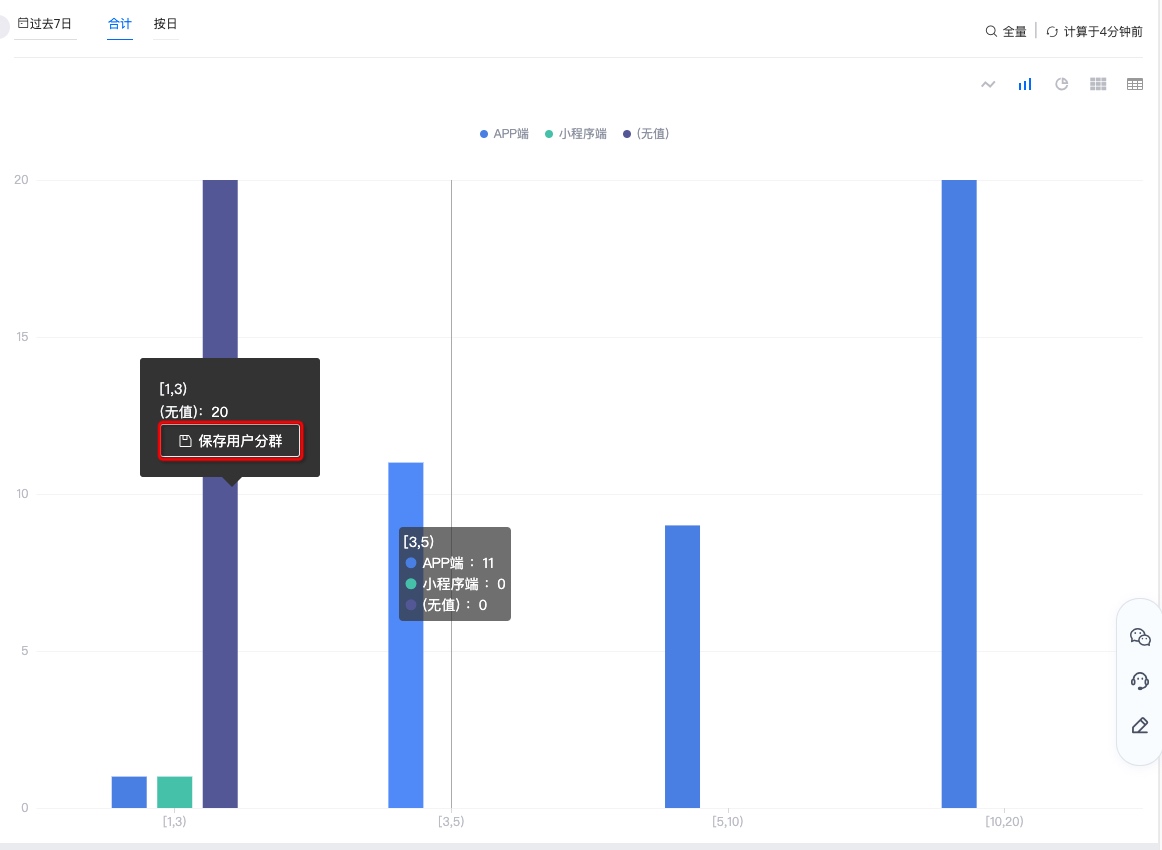
Click the icon or user count in the table to save a user segment.
Distribution Analysis Management
Supports save, save as copy, download, add to dashboard, view referencing dashboards, delete chart, update history, and sharing.
After modifying metrics, click Save to update.
Click Save as to create a copy with name and description.
Click Download for metrics and detailed data.
Click Add to dashboard to save under My Dashboard - My Groups.
Click Dashboards referencing this chart to see usage.
Click More - Delete chart and confirm to delete.
Click More - Update history for operation logs.
Click Add sharing with options: only me, all project members, or specified members.
All project members: new members get View only by default; permissions can be changed per user.
Specified members: search and add users/roles.