Interval Analysis
Interval analysis is mainly used to calculate the time interval from when users trigger a specified starting event to when they complete a specified target event.
Overview
Interval analysis has many application scenarios. It can be used to calculate product login intervals, repurchase cycles, and other metrics as an analysis tool for measuring user activity and user stickiness. It can also supplement conversion funnel analysis by using conversion duration metrics to measure the conversion efficiency of a specific conversion path in the time dimension.
When used for conversion efficiency evaluation, interval analysis supplements conversion funnels. However, the two focus on different aspects: interval analysis focuses on the time efficiency of user conversion completion, while conversion funnels focus on conversion result metrics and the conversion and loss of each step in the conversion process.
While paying attention to conversion results and dimensions that affect those results, we also need to pay attention to efficiency metrics in the conversion process. For example, for a financial management app, guiding traffic from a landing page to the first deposit involves many conversion steps. In addition to the final conversion rate, it is necessary to pay attention to conversion efficiency between core steps, especially registration and card binding.
Through interval analysis, you can observe the distribution of time intervals between two specified events completed by users. Combined with other analysis models, this helps reveal patterns behind user behavior and discover clues for improving user experience, increasing activity, improving product conversion rates, and continuously enhancing product value.
Create Interval Analysis
Go to Behavior Analysis -> Interval Analysis, and click New Interval Analysis.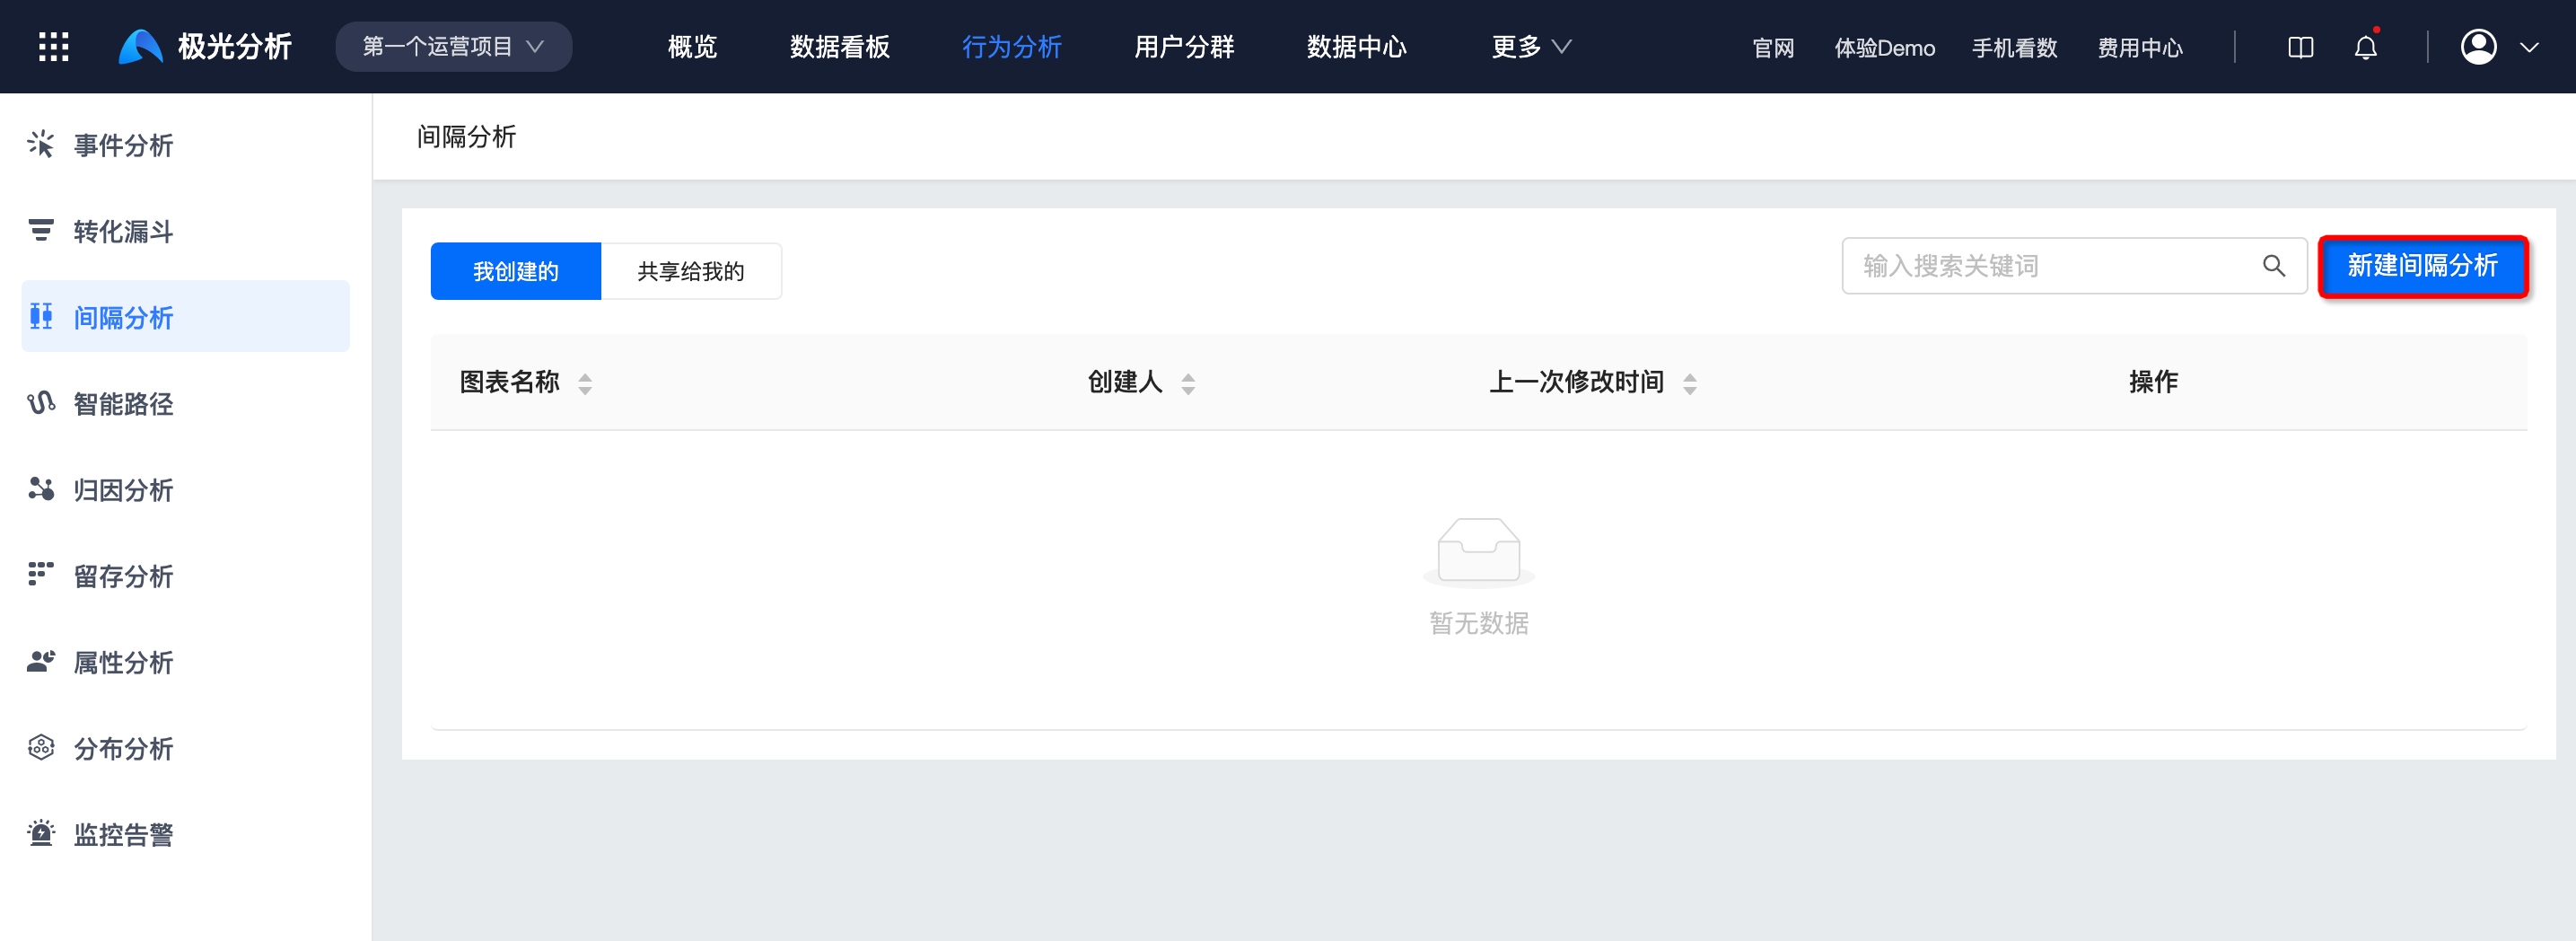
Set Starting Behavior/Conversion Target
The starting behavior and conversion target can be the same event or different events. By adding filtering conditions, events can be defined more precisely.
For example, you can set both the starting event and target event to Launch to calculate the time interval between two launches. Set both to Order Payment Successful to calculate the repurchase cycle. Set the starting event to Registration Completed and the target event to Order Payment Successful to observe the conversion duration from registration completion to first purchase completion.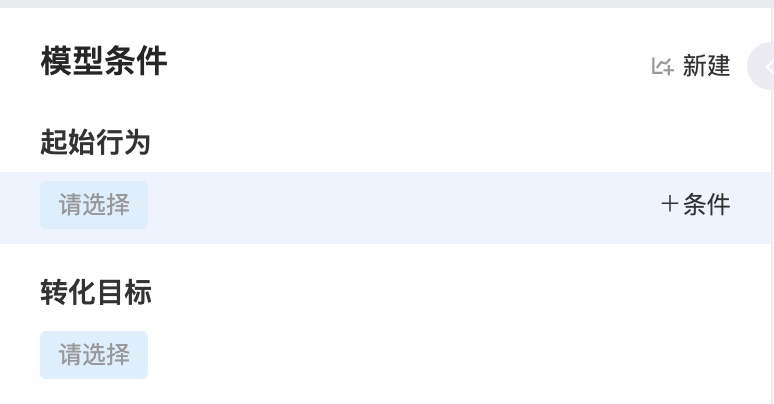
Set Conversion Window
The conversion window is the maximum time limit for completing the starting event and conversion target event. It can be set to a minimum of 1 minute and a maximum of 180 days, and supports three time granularities: minutes, hours, and days.<br /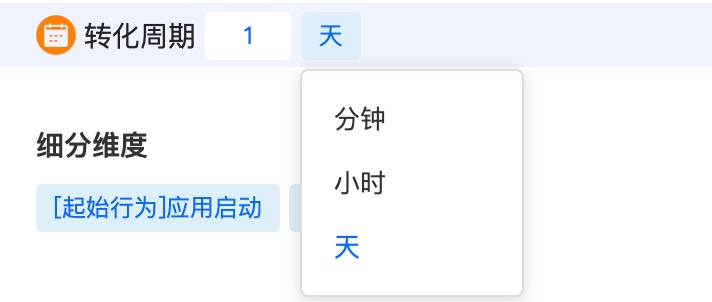
Select Breakdown Dimension
Selecting the starting behavior, conversion target, or any step as the breakdown dimension is supported.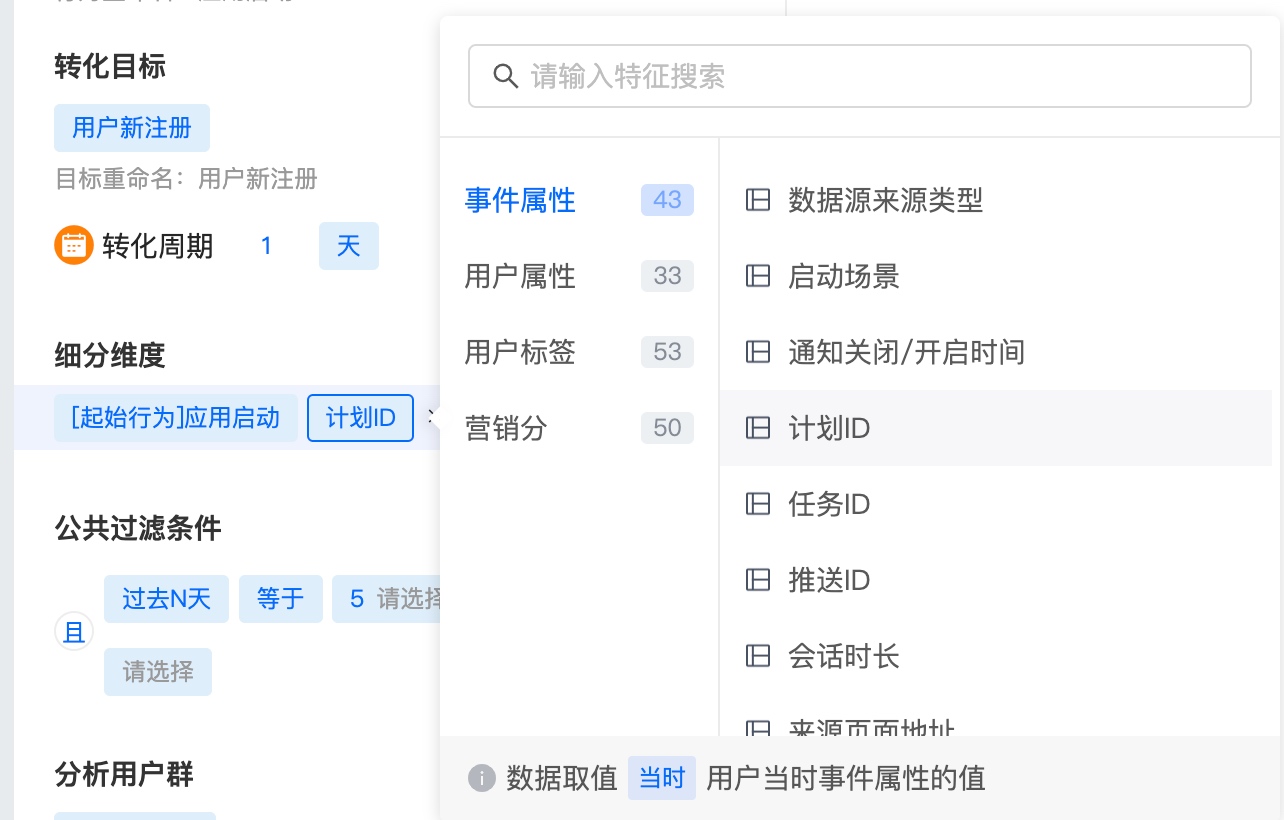
Set Common Filters
For a single event, condition restrictions can be added. Common filters can also be added to constrain multiple metrics. Conditions are structured as attribute - operator - attribute value. Attributes include two types: event attributes and user attributes.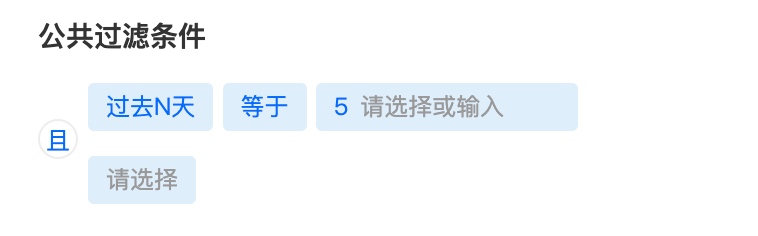
Select Comparison Segments
Jiguang Analytics supports viewing metrics under a specific breakdown segment and comparing multiple segments.
Set Chart Display
After setting event metrics, click Query to view the chart.
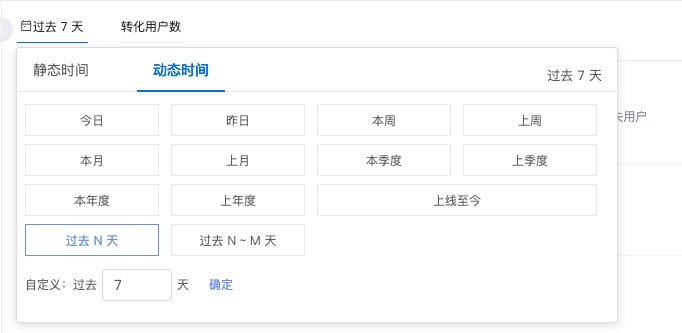
Select Time Range
- You can select common ranges such as the last 30 days, today, and last week, or customize the start and end time on the right.
- After a chart is saved with a relative time range, future queries display a dynamic time range. For example, if today is March 16 and you query the last 7 days, the result is data from March 9 to March 15. When opening the saved chart on March 21, the data shown will be from March 14 to March 20.
- The time range restricts the date when the starting behavior occurred. For example, if [2018/03/01-2018/03/07] is selected with [starting behavior = registration, subsequent behavior = any event], the calculation is for users who registered on each day during 2018/03/01-2018/03/07 and returned again within the following 30 days.
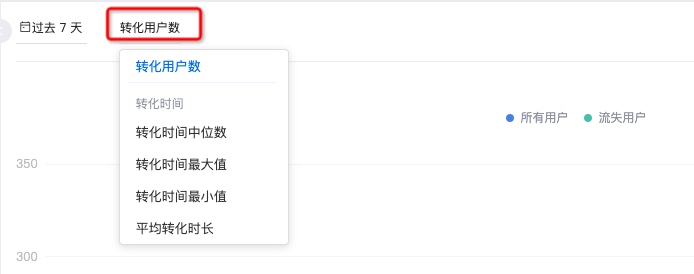
Select Metrics
Interval analysis currently provides 5 metrics:
- Converted users
- Median conversion time
- Maximum conversion time
- Minimum conversion time
- Average conversion time
Set Sampling Calculation Ratio
Setting the sampling calculation ratio is supported. Options are as follows: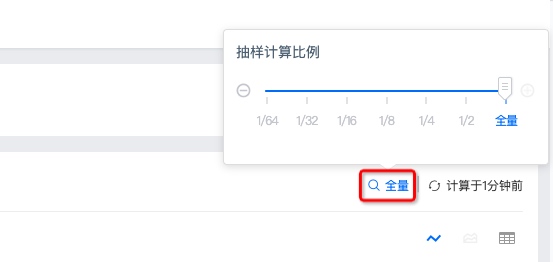
Force Refresh
The upper-right corner shows the last refresh time. To view current data, click to force refresh.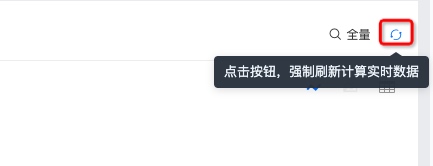
Chart Style
You can view a single metric through a line chart, or observe all metrics at the same time through a table.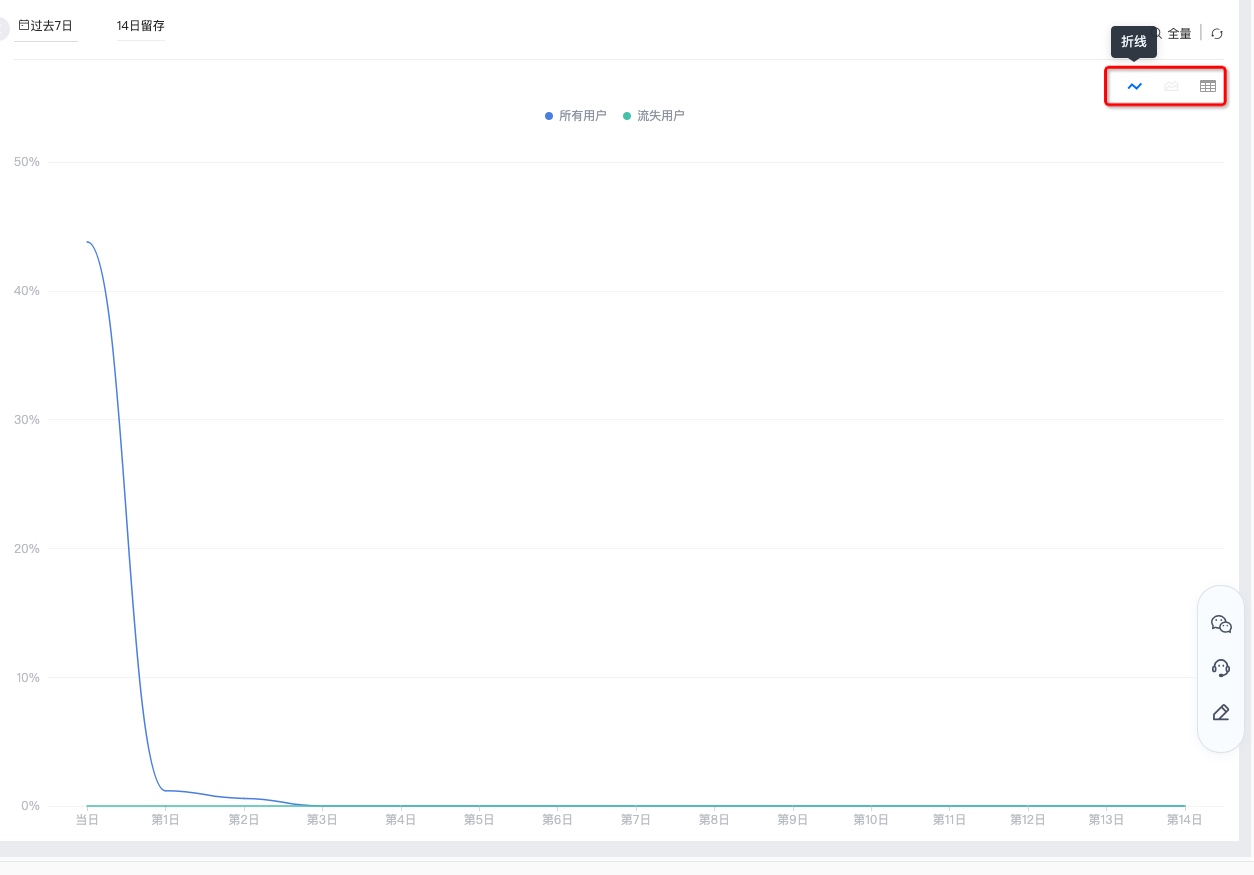
Save Analysis
Click Save in the upper-right corner and enter a name to successfully create the interval analysis.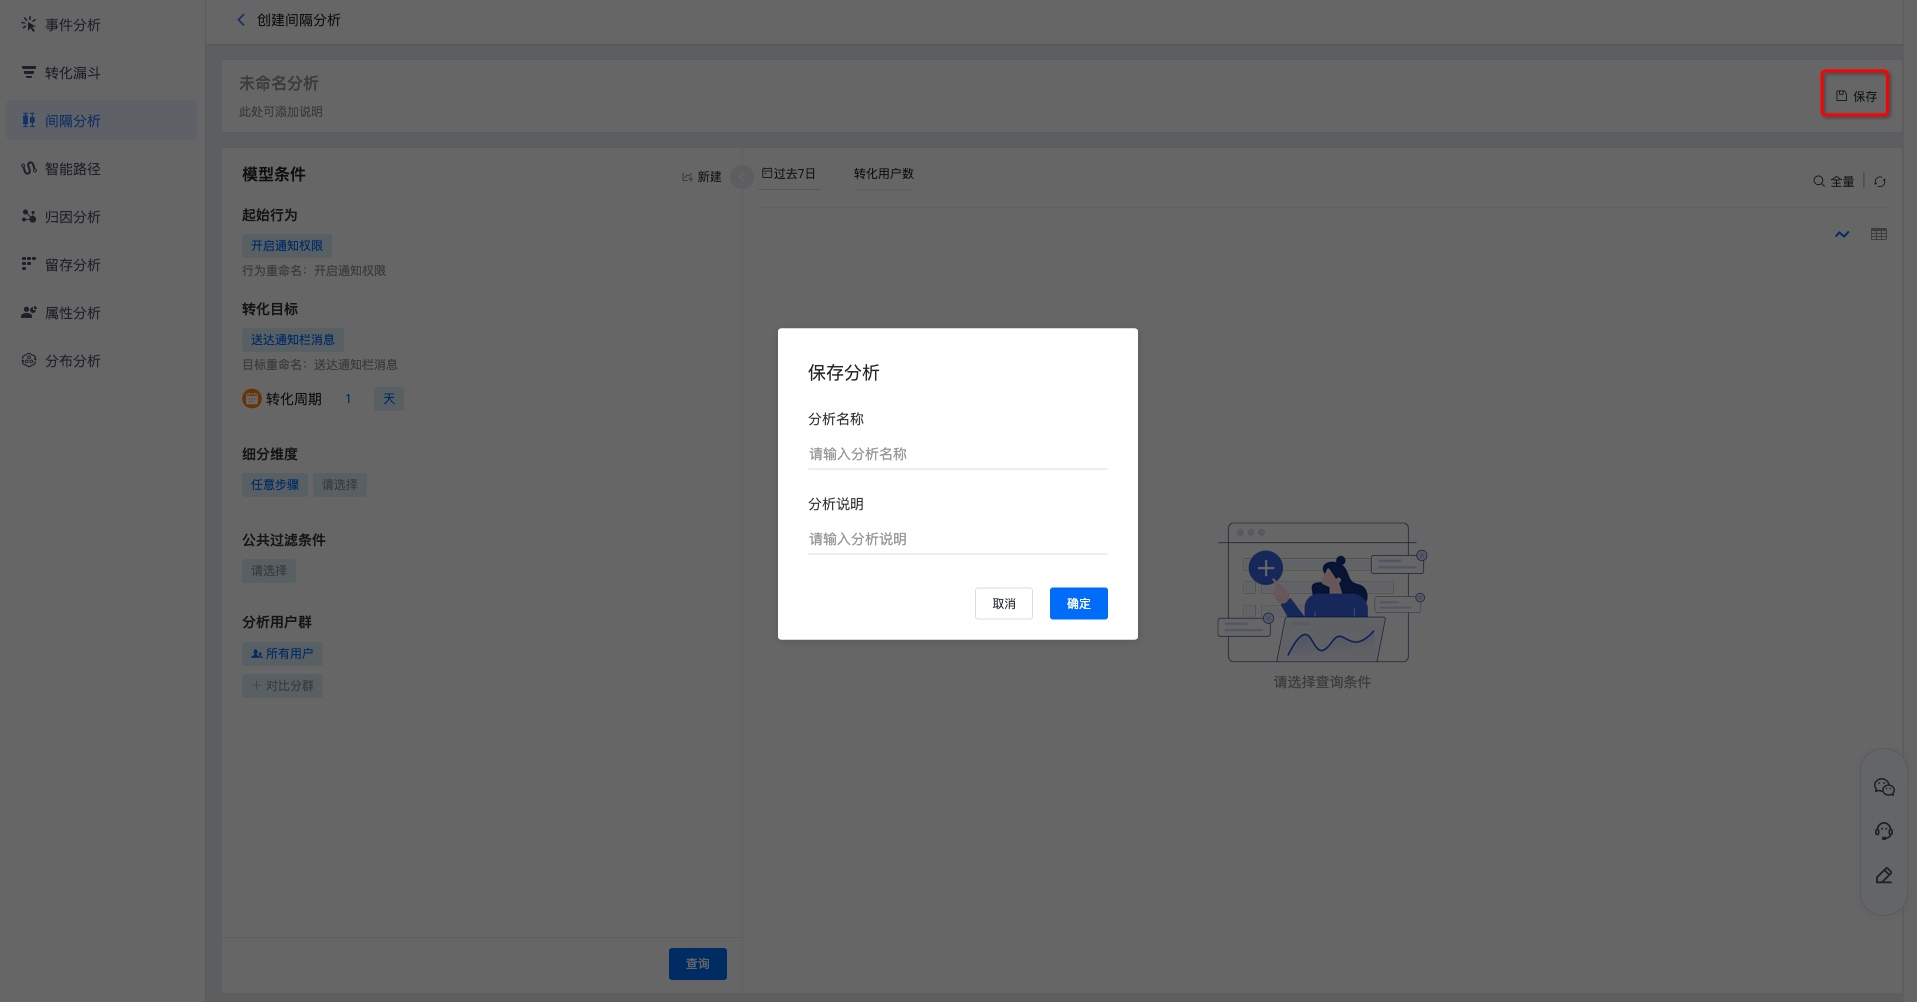
View Interval Analysis
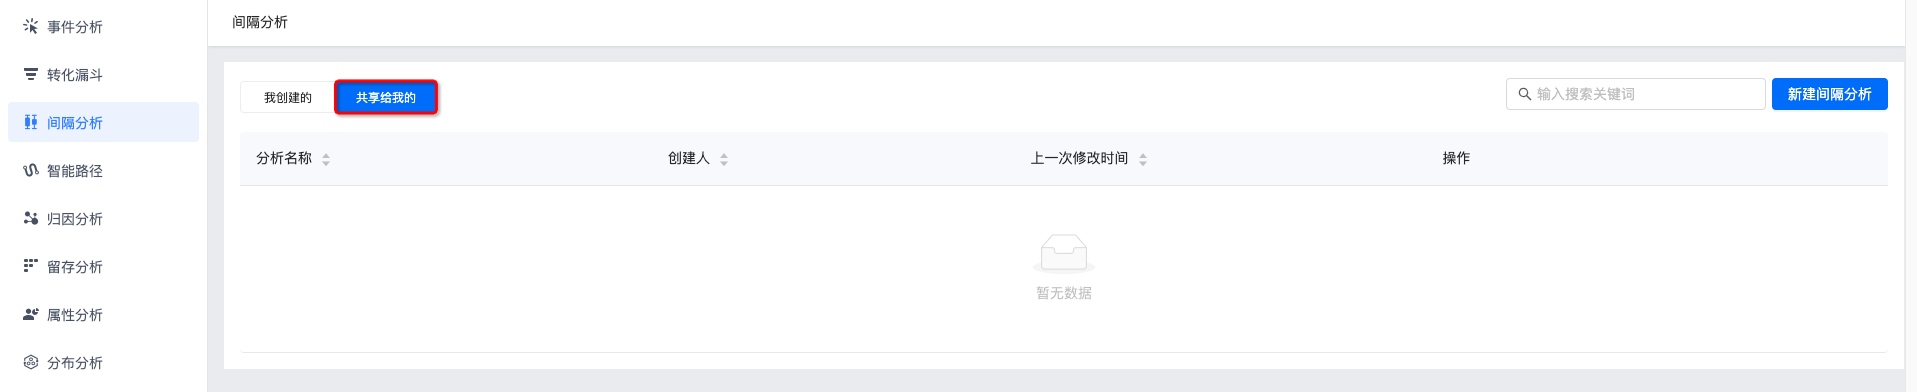
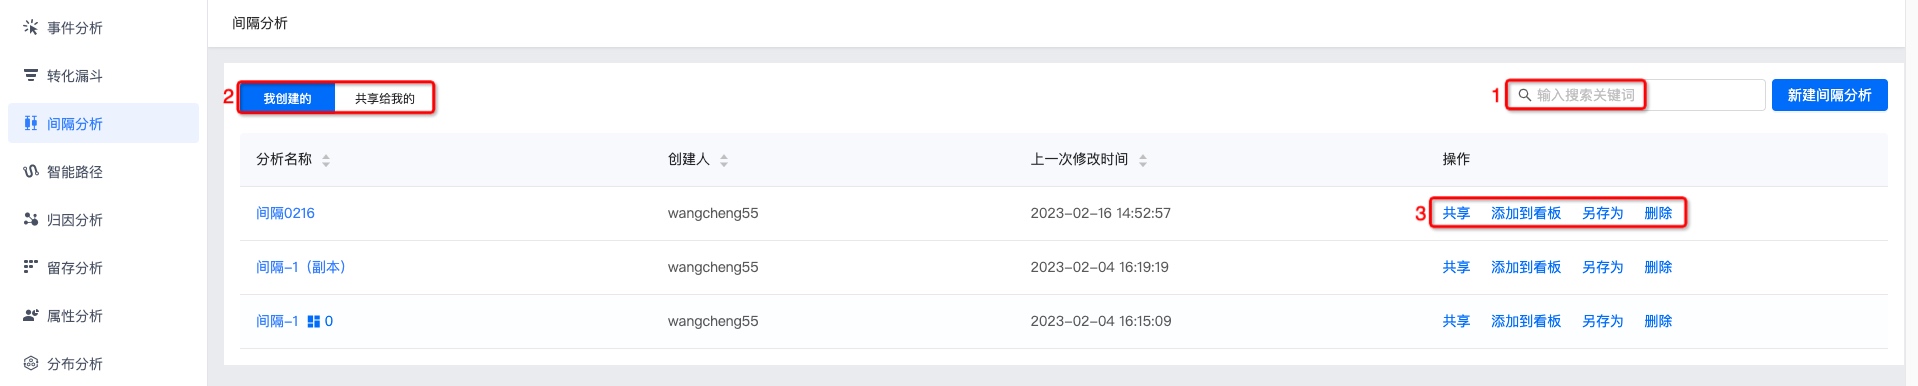
Searching by interval analysis name in the search box is supported.
Viewing interval analyses created by me and shared with me is supported. Click an interval analysis name to view the interval analysis results.
Sharing, adding to dashboard, saving as, and deletion are supported. For details, see Interval Analysis Management.
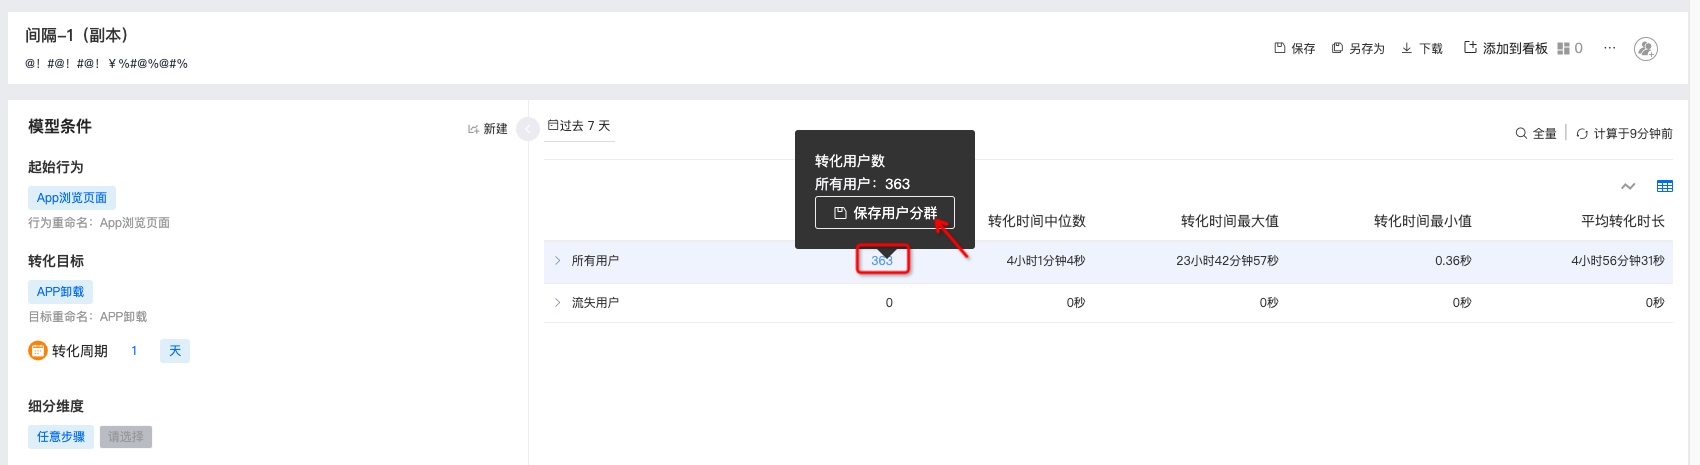
Click the number of users in the table to save a user segment.
Interval Analysis Management
Saving, saving as, downloading, adding to dashboard, viewing dashboards that reference this chart, deleting charts, viewing update records, and adding sharing are supported.
After modifying interval analysis metrics again, click Save to complete the update.
To create a copy of an interval analysis, click Save As, enter the copy name and description, and save.
To download interval analysis data, click Download. The downloaded content includes the configured metrics and detailed data.
Click Add to Dashboard to save it under My Dashboard -> My Group.
Click Dashboards Referencing This Chart to view which dashboards use this interval analysis.
Click More -> Delete Chart, and delete the chart after secondary confirmation.
Click More -> Update Records to view operation logs for updates to the interval analysis.
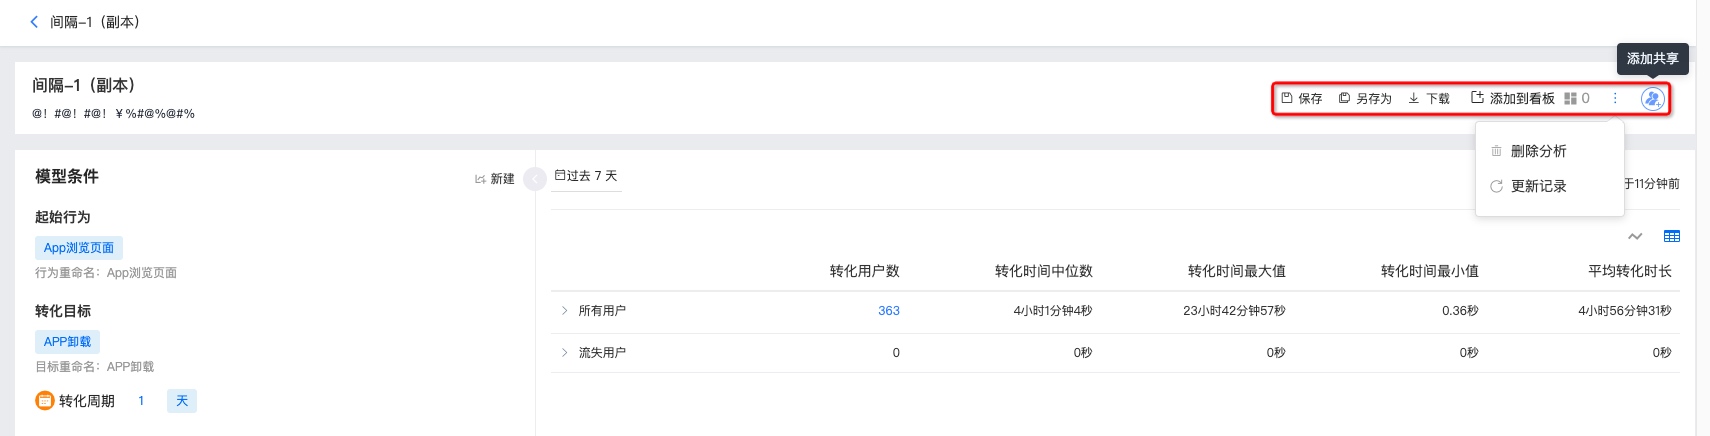
Click Add Sharing to share the interval analysis with other people. It supports setting visibility to only yourself, all project members, or specified members. Users granted permission can view it under interval analyses shared with me.
Visible to all project members: newly added members in the project will be added by default and granted the view-only role. You can search for users to modify permissions individually.
Visible to specified members: you can search and add certain users/roles and grant permissions.