event analysis
Event refers to the user’s APP, websites and other applications, that is, who, when, where, through what method, and what was done. The event analysis model is mainly used to analyze user behavior on applications, such as opening APP, registration, login, payment order, etc. User behavior is measured through basic indicators such as the number of triggered users, the number of triggers, and the access duration. It also supports the calculation of indicators to build complex indicator measurement business processes.
Applicable scenarios
- Statistics on product usage: such as statistics on the usage of functions such as search, likes, playback, and barrages.
- Statistics on content consumption: such as counting the number of people viewing each article, the number of views, and the viewing time.
- Statistics of user conversions through different channels: such as statistics on application markets,Mini-program、Official AccountRegistration and payment status of new users through other channels.
- Statistics on the usage of different population characteristics: such as statistics on the purchase demand for hairy crabs in different cities in Guangdong Province.
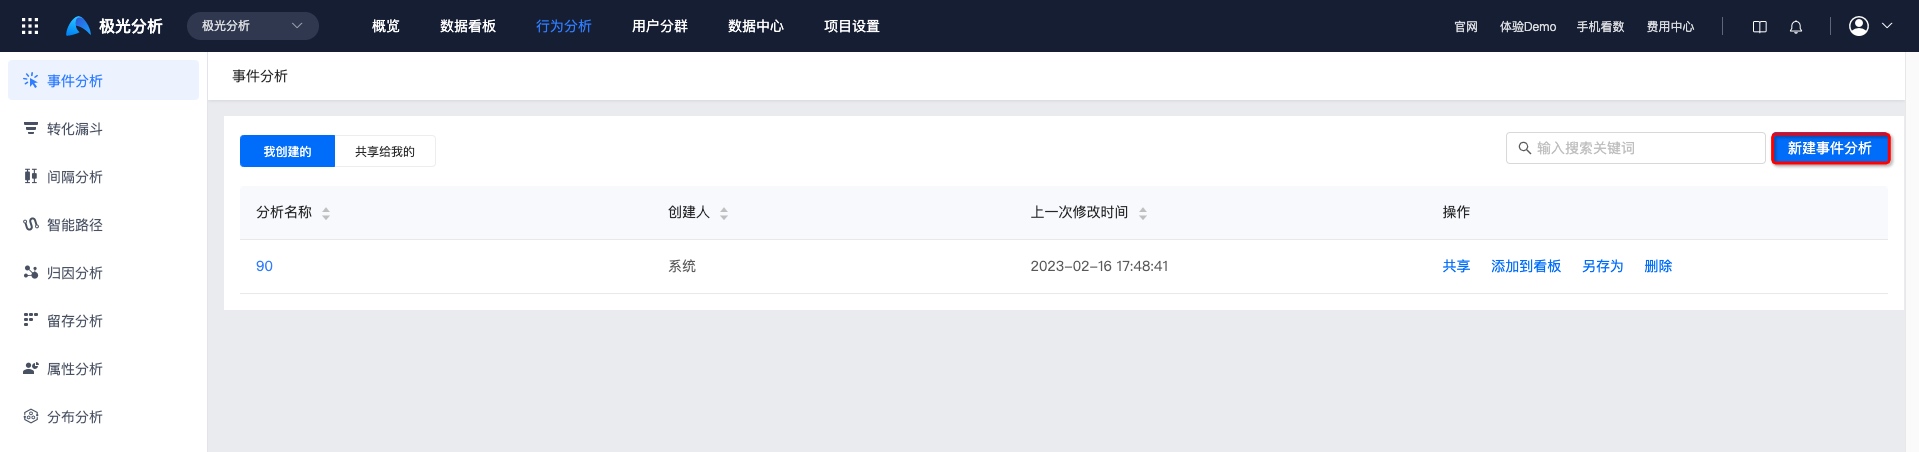
Create event analysis
Enter the [Analysis Center]-[Event Analysis] page and click "New".
Add event
You can choose according to your business needsmeta-event, virtual events and combined events for analysis. Example: What is the purchasing power of users in various channels in Shenzhen in the first quarter?
- Click "Any Event" to add the event that needs to be analyzed.
There is data to reportmeta-event, virtual events and all combined events will be displayed in the event list.
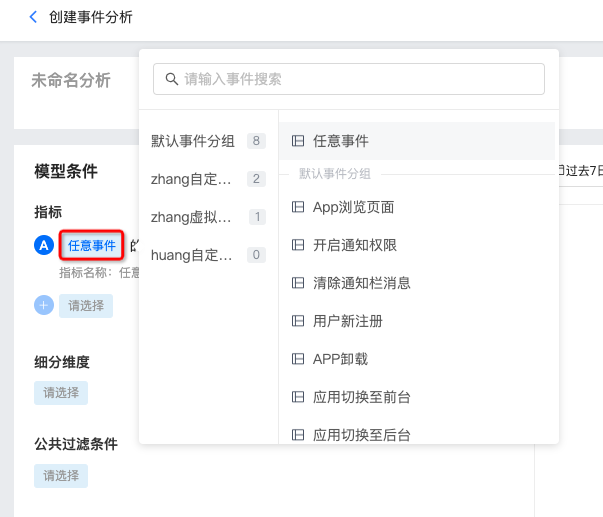
- If you need to add multiple events, click "+" to add them.

Select event indicators such as the number of events and the number of users.
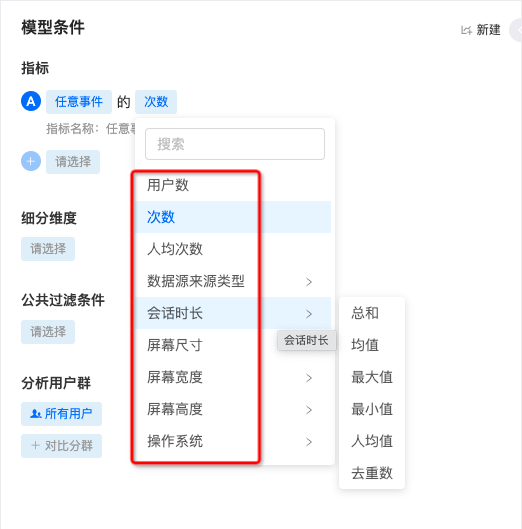
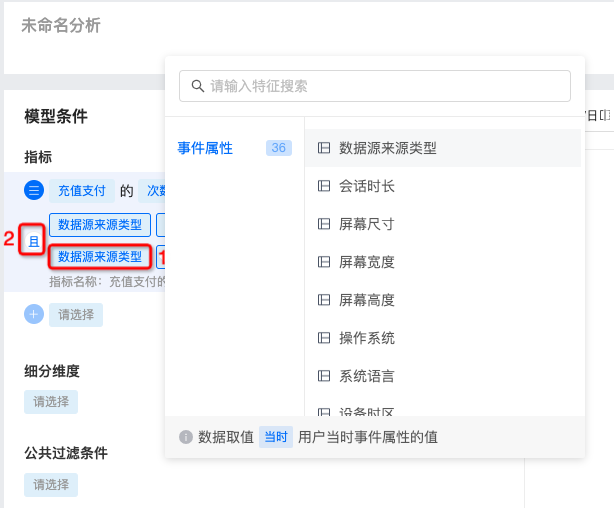
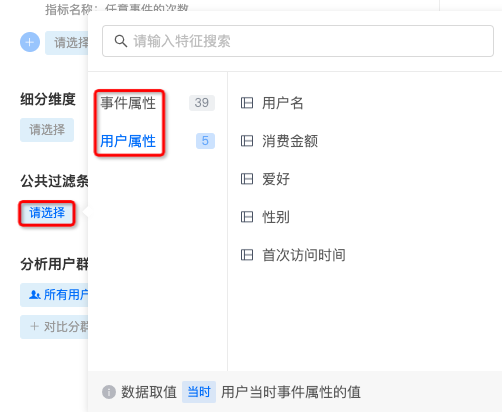
Click "Conditions" to add filter conditions. At 1, you can select the corresponding values of event attributes and user attributes.
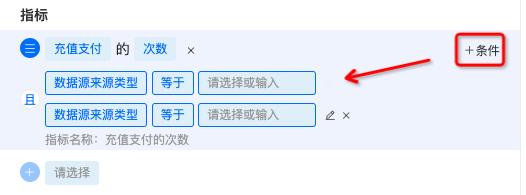
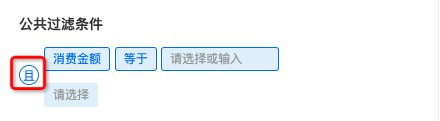
- If you add multiple filter conditions, click 2 places to switch the intersection and union relationship.
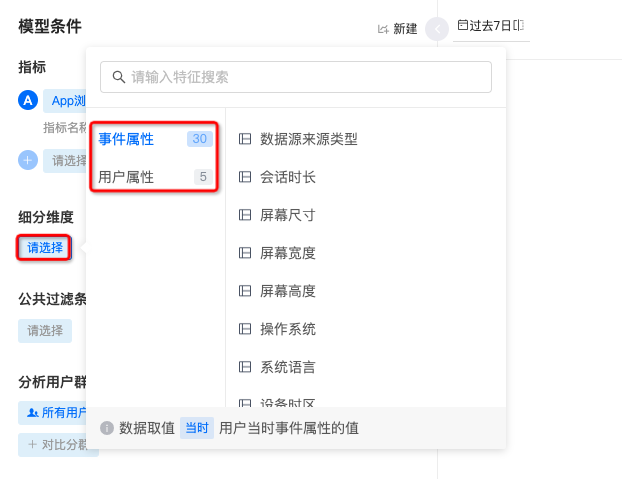
Select subdivision latitude
In order to provide more refined analysis, data analysis is supported through multiple dimensions. Dimensions refer to the angles from which things are analyzed. Event properties and user properties can be selected. Example: We can group user purchase channels to compare the number of users in different purchase channels.
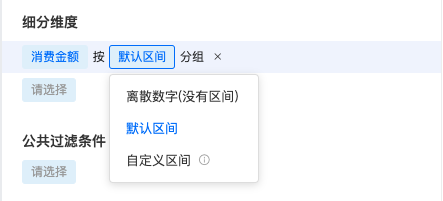
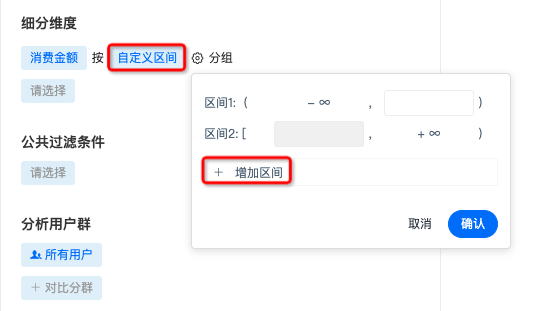
- Dimensions support the selection of discrete numbers, default intervals, and custom intervals. Custom intervals need to set the interval range, and support adding multiple intervals.
Set public filters
Conditional restrictions can be added to a single event, or public filtering conditions can be added to constrain multiple indicators. The condition is formed according to the structure of Attribute - Operator - Attribute value, and the attributes include two types: Event attributes and User attributes.
- Supports adding multiple filter conditions, the default is intersection relationship, click "and" to switch the intersection relationship.
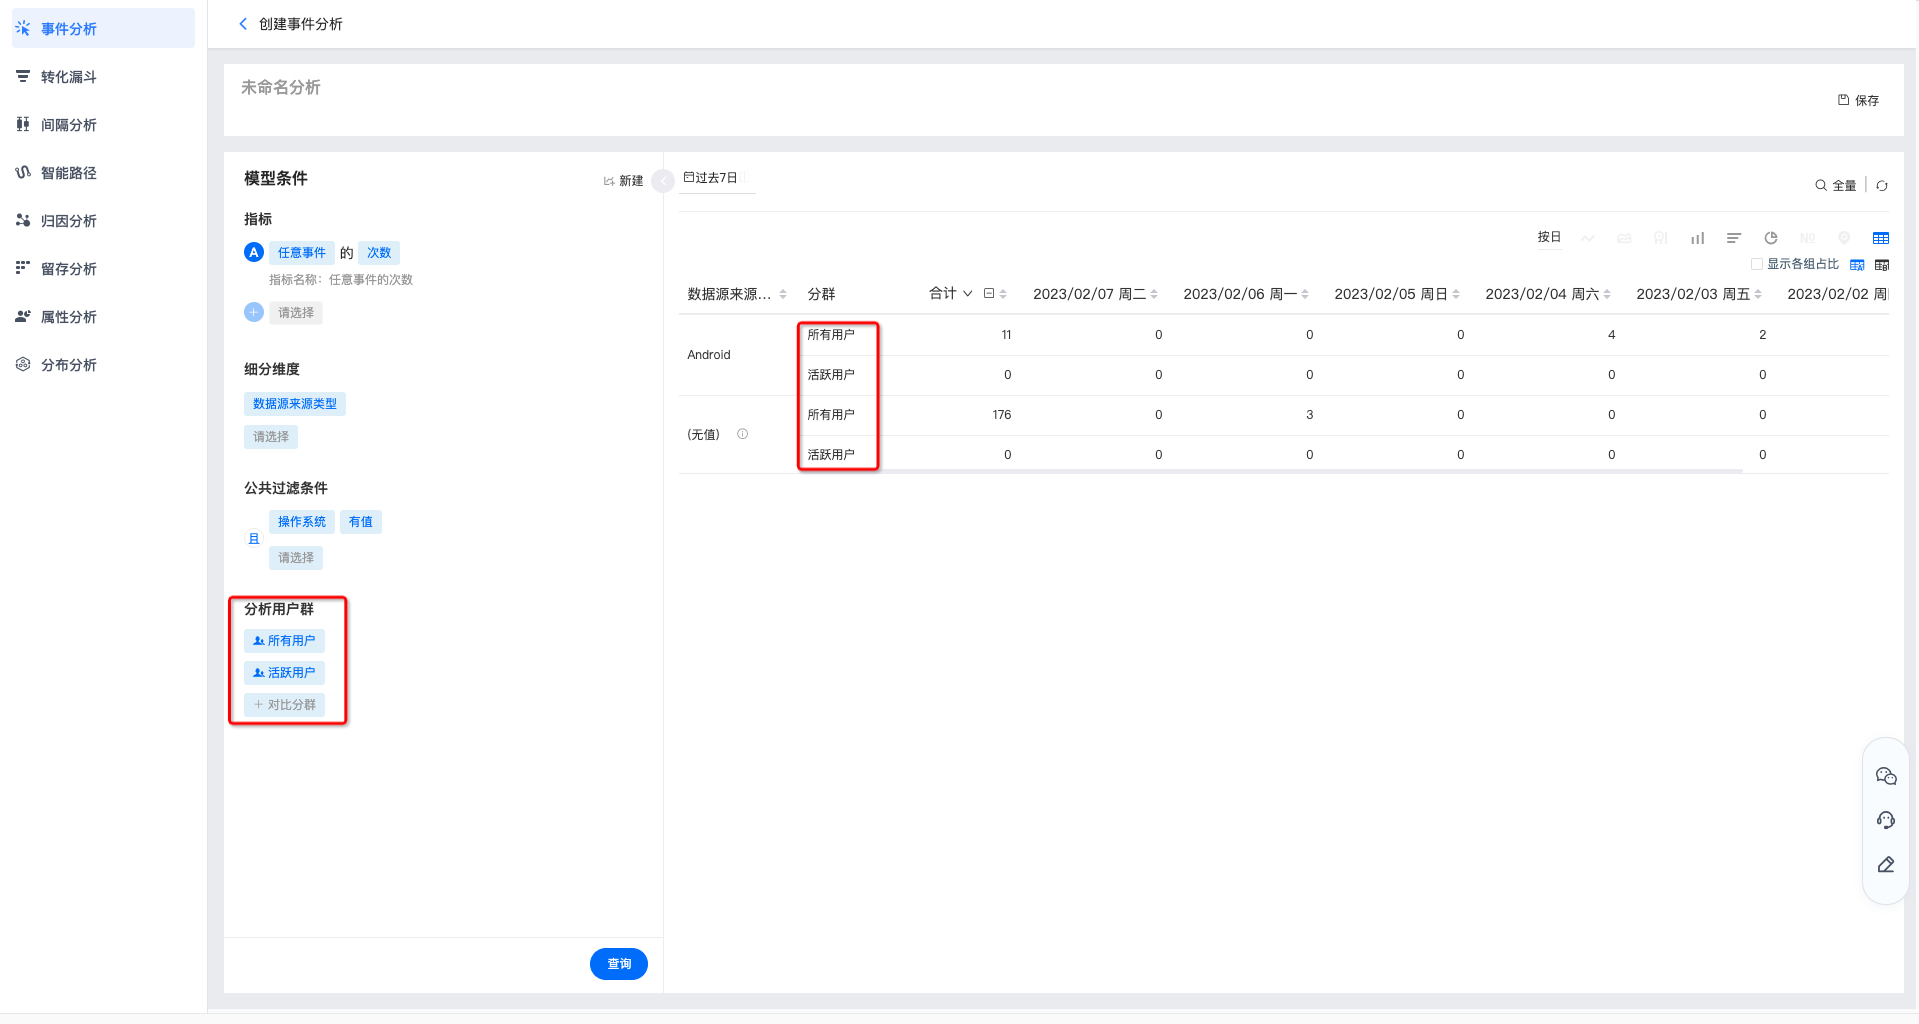
Select comparison group
JiguangThe analysis supports viewing indicators under a certain segmentation group, and also supports comparison among multiple groups.
Set up chart display
After setting the event indicators, click "Query" to view the chart.
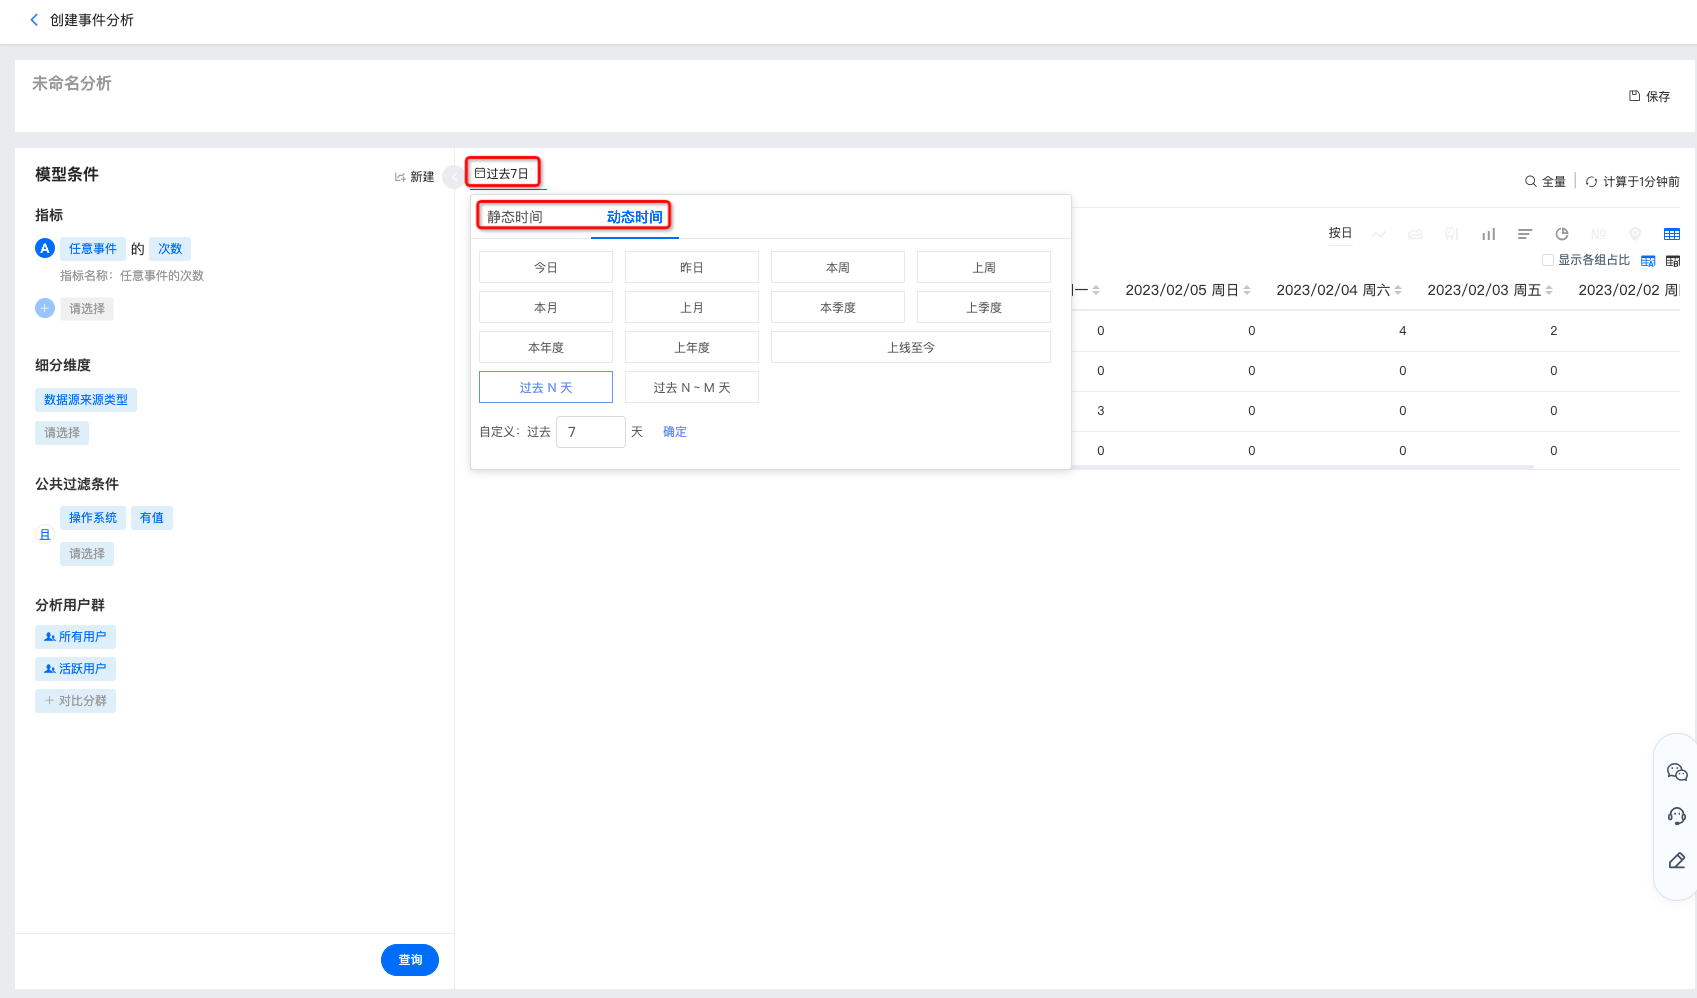
Select time range
- You can select common ranges such as the last 30 days, today, and last week, or you can customize the start time and end time on the right.
- When a relative time is selected to save the chart, the dynamic time range will be displayed during subsequent queries. For example, today is March 16, and if you select the query for the past 7 days, the query result is the data from March 9 to March 15; when you open the saved chart on March 21, the data you view will be from March 14 to March 20.
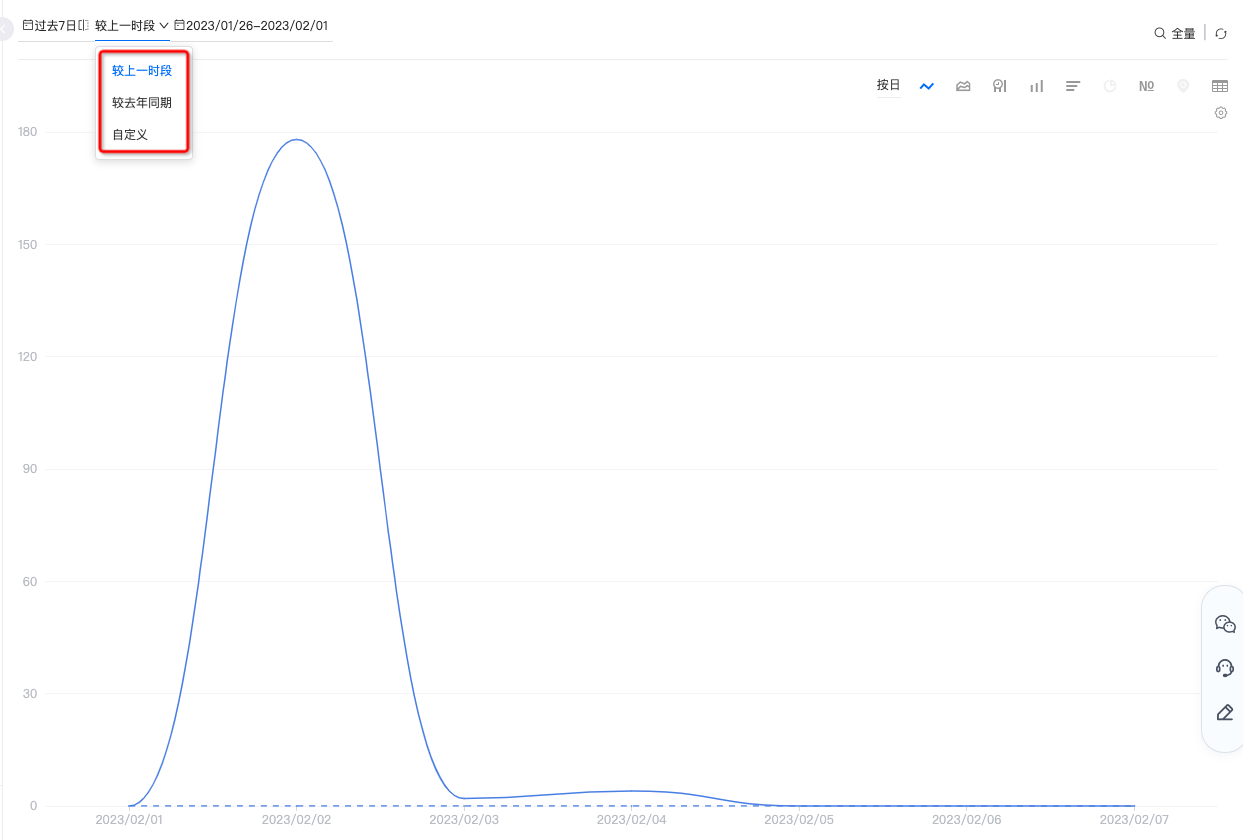
- When selecting a comparison date, you can compare the performance of the previous period, the same period last year, and custom comparison indicators. Note: Comparing dates only supports the analysis scenario of 1 indicator and 1 group.
- Compare to the previous period: Move the time range the same number of days backward from the selected time range. For example, the currently selected time range is January 9th - January 15th. If you select to compare the previous time period, the comparison is from January 2nd to January 8th. That is, you can compare the indicator differences between January 9th and January 2nd, and January 10th and January 3rd.
- Compare the same period last year: Compare the current time period with the same period last year. For example, the current selection is 2019 From January 9th to January 15th, if you choose to compare the previous time, the comparison is 2018 From January 9th to January 15th, you can compare them separately. 2019 On January 9, 2018 January 9,2019 On January 10, 2018 Differences in metrics on January 10, 2019.
- Custom comparison: Customize the time range. For example, the current selection is January 9th - January 15th. Custom comparison is January 8th - January 14th. You can compare the indicator differences between January 9th and January 8th, and between January 10th and January 9th.
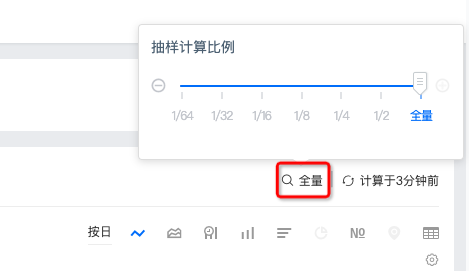
Set sampling calculation ratio
Supports setting the proportion of sampling calculation, the options are as follows:
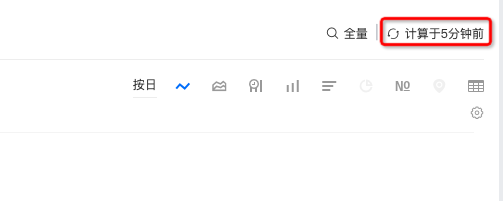
Force refresh
The upper right corner will display the time point of the last refresh. If you need to view the current data, you can click to force refresh.
time granularity
The selectable time granularity is as follows:
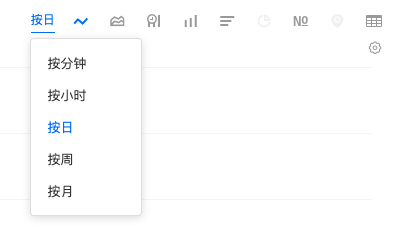
| Time Granularity | illustrate |
|---|---|
| by minute | Aggregated by minute, calculated in real time |
| hourly | Aggregated by hour, calculated in real time |
| by day | The default is from 00:00:00 arrive 23:59:59 Full day aggregation of, delayed by up to a few minutes when today is included in the time range |
| by week | The default is the aggregation of natural weeks from Monday to Sunday. When the time range is less than the natural week, the aggregation of several days of the week in the selected range is calculated. |
| by month | When the time range is less than a natural month, the calculation is the aggregation of several days in the month within the selected range. |
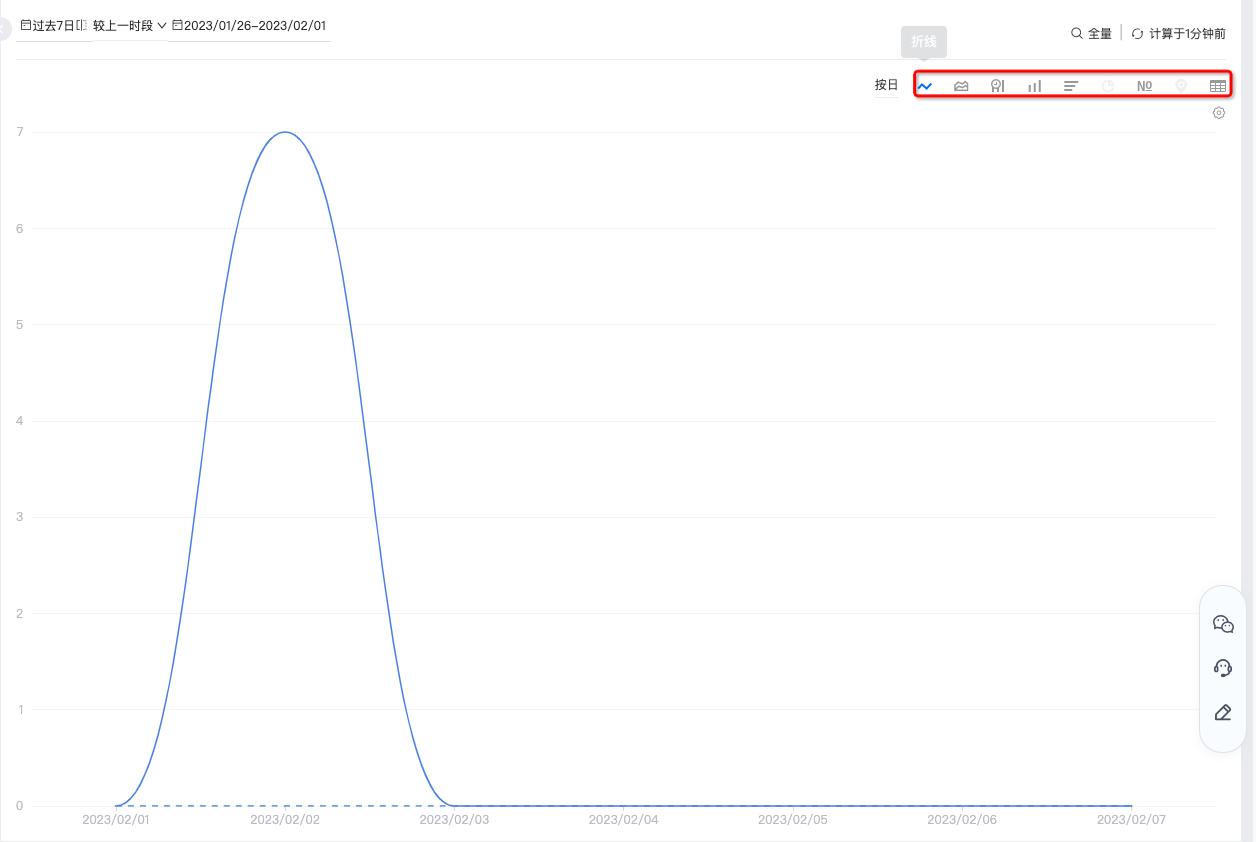
chart style
Display query results of different indicators, conditions, groups of people, and dimension combinations. The display styles include line charts, area charts, time histograms, histograms, bar charts, digital charts, and data tables, etc.
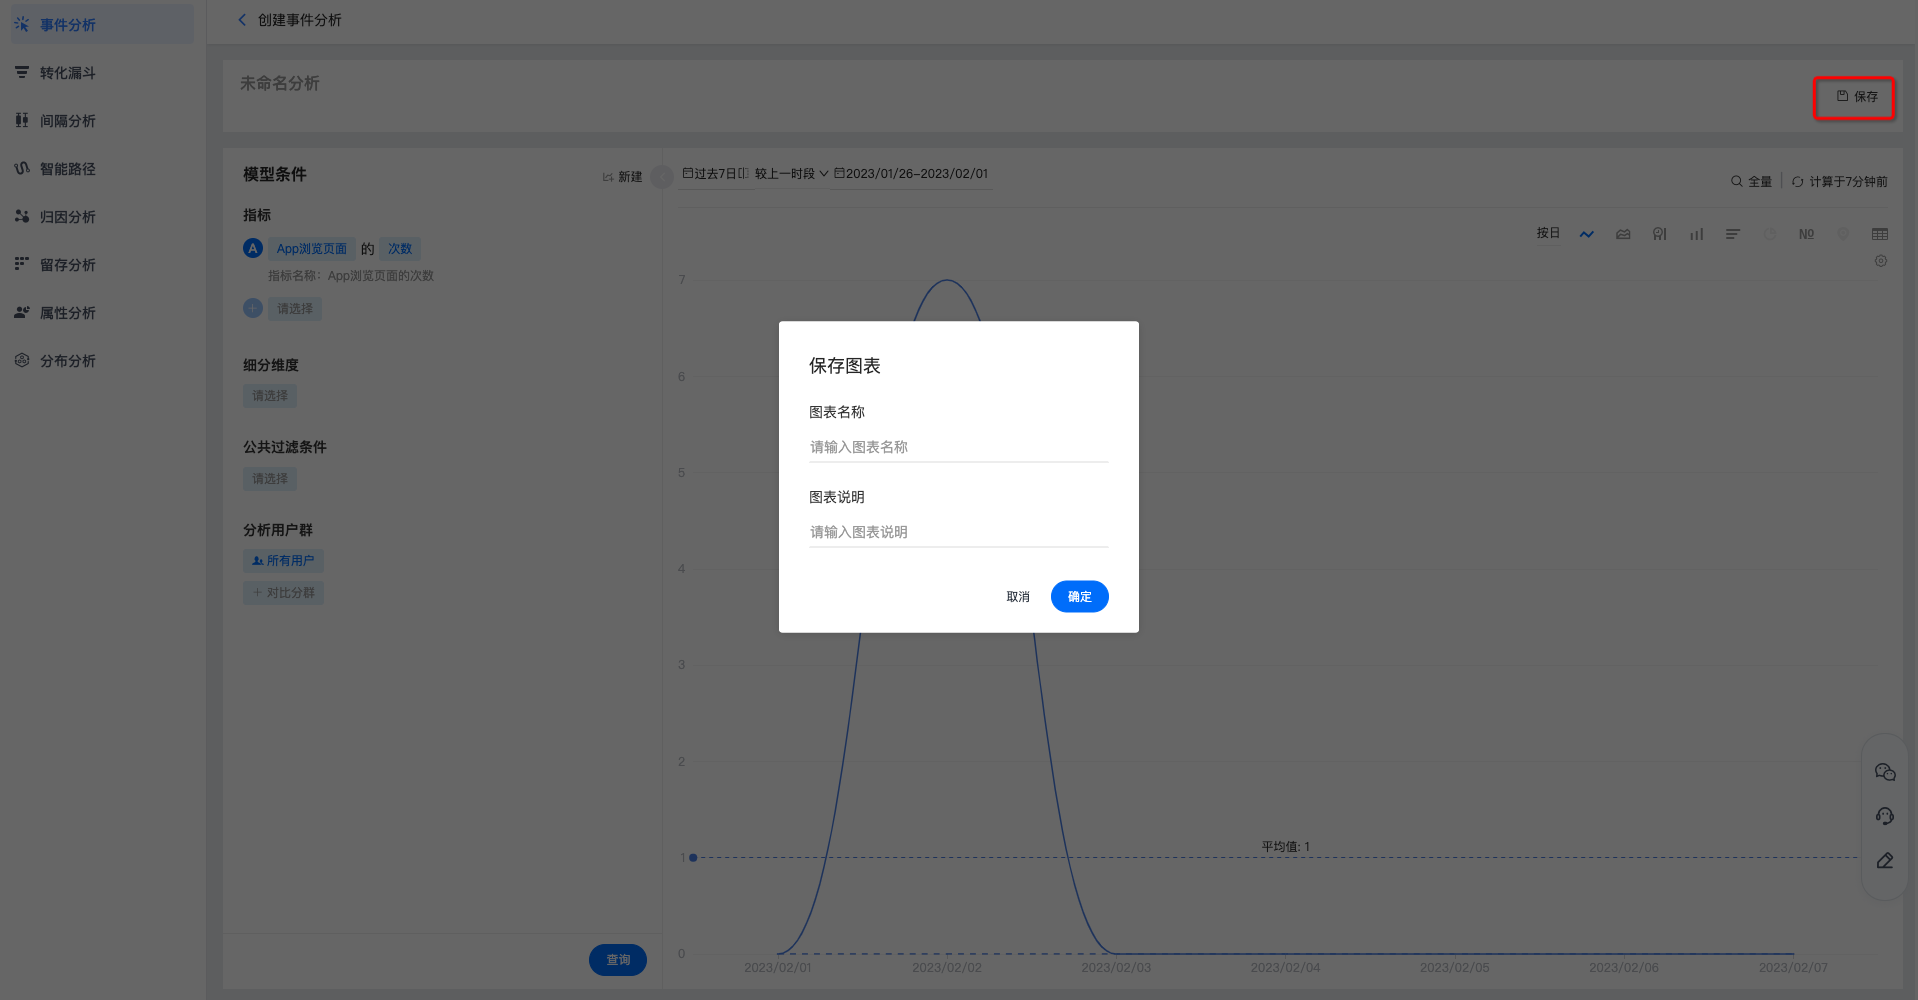
Save event analysis
Click "Save" in the upper right corner, fill in the chart name and chart description, and then you can view the calculation of this event on the main event analysis page.
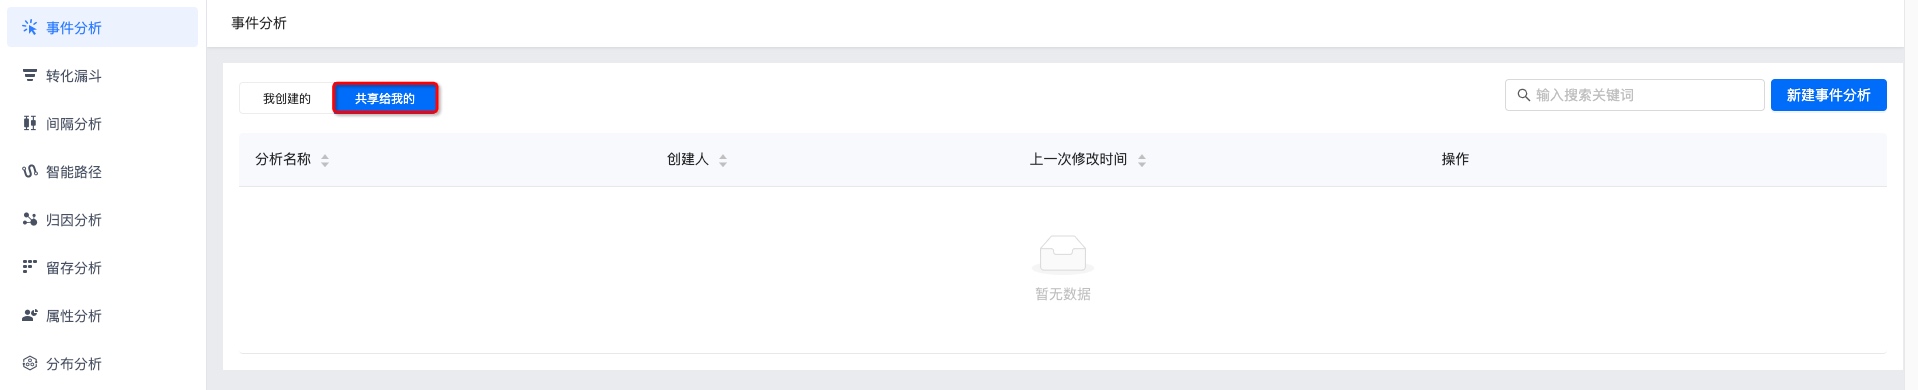
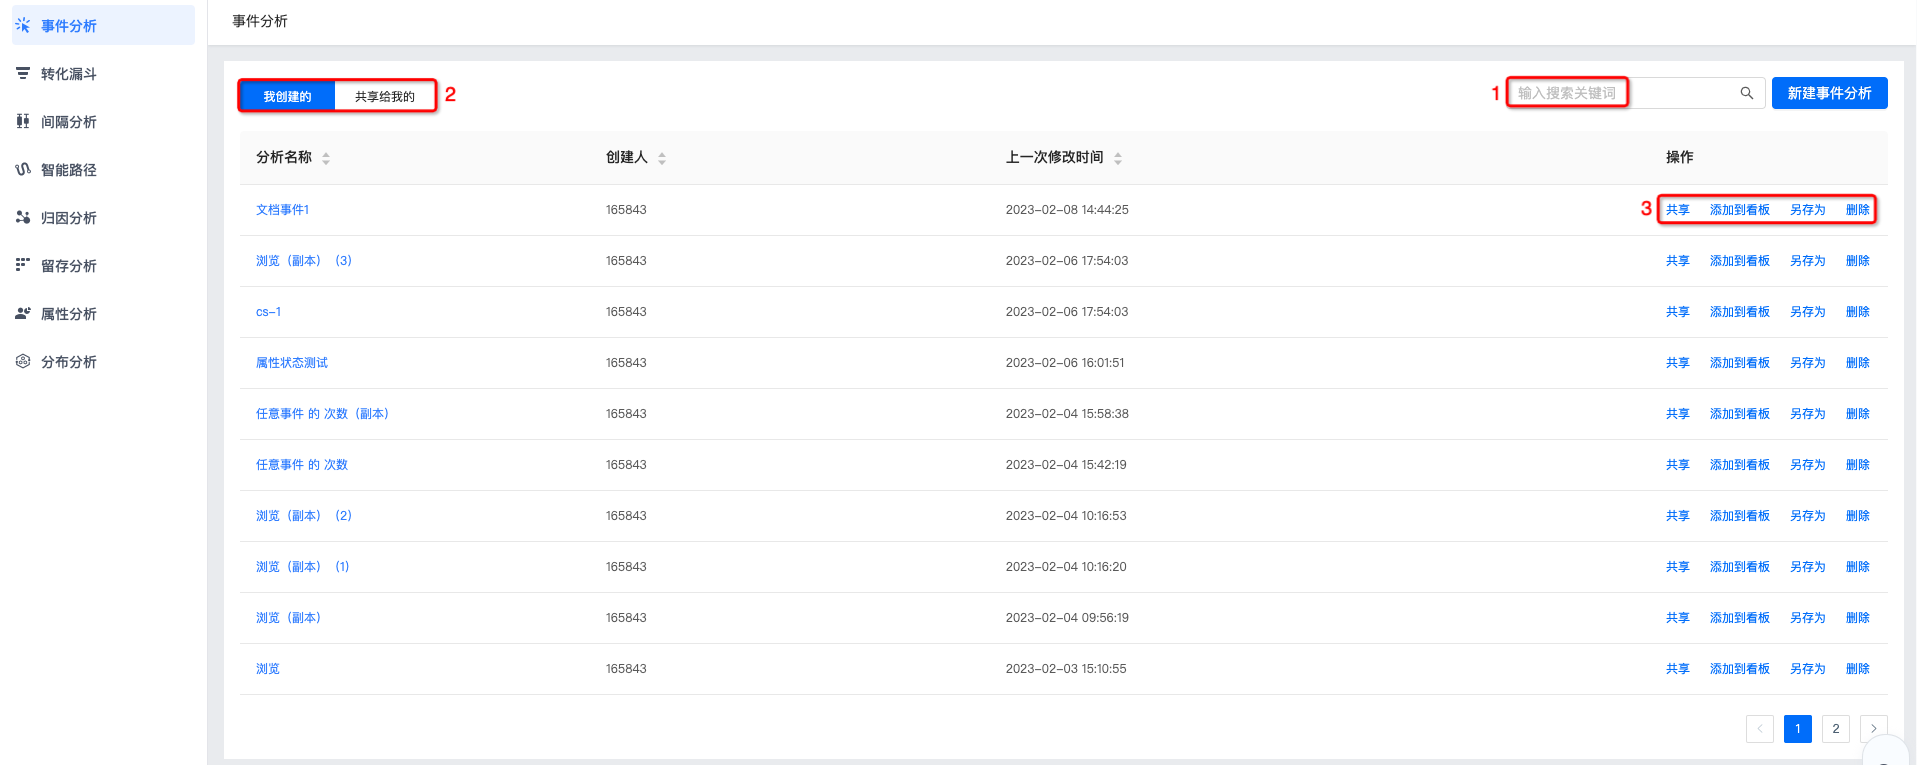
View event analysis
- Supports viewing the event analysis of "created by me" and "shared with me". Click the event analysis name to view the event analysis results.
- Support search box to search event analysis name.
- Supports sharing, adding to the board, saving as, and deleting operations, please refer to the detailed instructions. Event Analysis and Management。
Event Analysis and Management
Supports saving, saving as, downloading, adding to the board, referencing the chart's board, deleting the chart, viewing update records and adding sharing functions.
- After re-modifying the indicators for event analysis, click "Save" to complete the update.
- If you need to create a copy of the event analysis, click "Save As", fill in the copy name and description, and save it.
- If you need to download event analysis data, click "Download". The download content includes the set indicators and detailed data.
- Click "Add to Board" to save it under "My Board-My Group".
- Click "Boards that reference this chart" to see which boards use this event analysis.
- Click "More-Delete Chart" and confirm twice to delete the chart.
- Click "More-Update Record" to view the operation log for updating the event analysis.

- Click "Add Sharing" to share the event analysis with other people. It supports settings such as visible only to yourself, visible to all members in the project, and visible to specified members. Users who have been granted permissions can view the event analysis in "Shared to Me".
- All members in the project are visible: subsequent new members in the project will be added by default and given<仅查看>Roles can search for users and modify permissions individually.
- Specified members are visible: Certain users/roles can be searched to add permissions.