conversion funnel
Funnel analysis is mainly used to analyze conversion and loss in a multi-step process. You can formulate corresponding plans to improve the conversion rate based on the conversion rate and data analysis of each step.
Funnel analysis logic description
- Suppose a funnel contains four steps A, B, C, and D. The selected time range is 2022 Arrives January 1 2022 On January 30, 2019, the window period is set to 1 day. Then, as long as the four steps A, B, C, and D are triggered within the selected time range, and the order of occurrence of the steps is consistent with A - B - C - D, and the completion time from A - D is less than or equal to 1 day, the user will be considered to have completed a successful funnel conversion.
- If the user's behavior is interspersed with some other behaviors that are not defined as funnel steps, for example, the user's behavior sequence is A - X - B - C - D, and X is a user behavior that is not defined as a funnel step, then the user is still considered to have completed a successful funnel conversion. If the user’s behavior sequence is A - B - C -
Applicable scenarios
- Funnel analysis of the product usage process: such as analyzing the conversion rate from user registration to ordering specific products.
- Funnel analysis of the content consumption process: such as analyzing the conversion rate from browsing to sharing of an article.
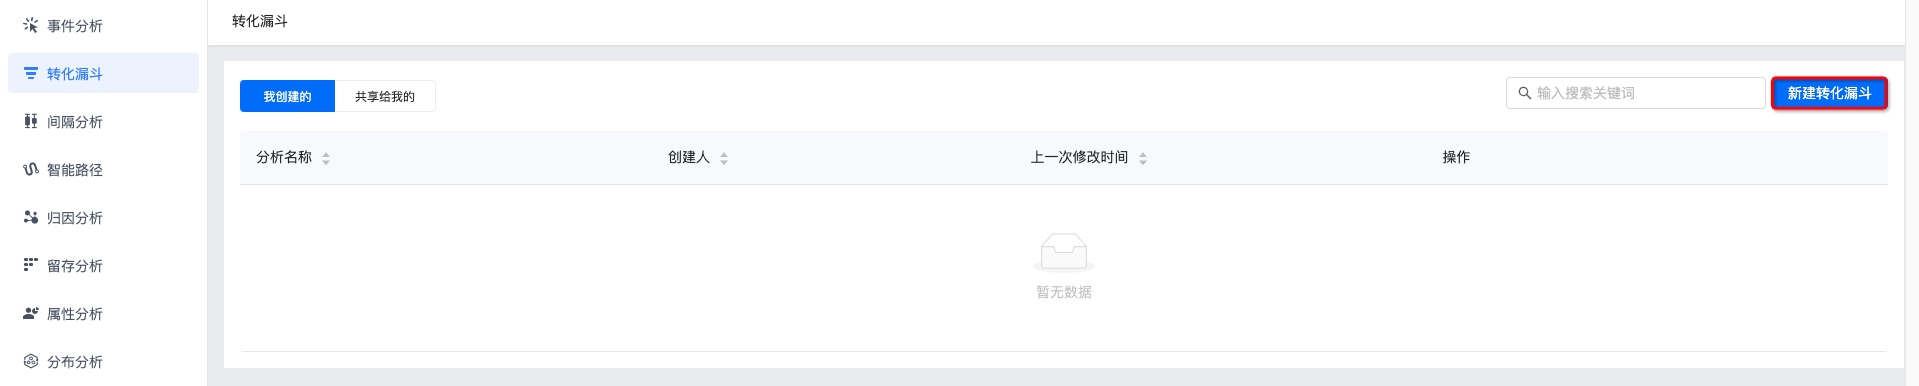
Create funnel analysis
Determine the target steps that need to be viewed in the conversion process, and select the corresponding groups of people, events, conditions, and display dimensions for conversion analysis. The following is an example of the Shenzhen gift package conversion process. Enter the [Analysis Center]-[Funnel Analysis] page and click "New".
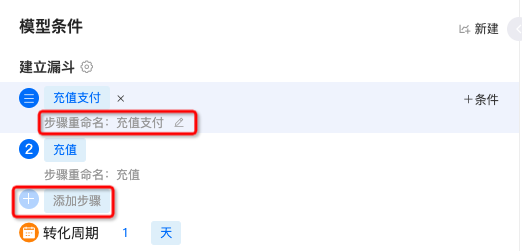
Build a funnel
Click "Add Step" and select the events that require conversion analysis. It supports adding multiple events.
There is data to reportmeta-event, virtual events and all combined events will be displayed in the event list.
Click "Edit" to rename the step.
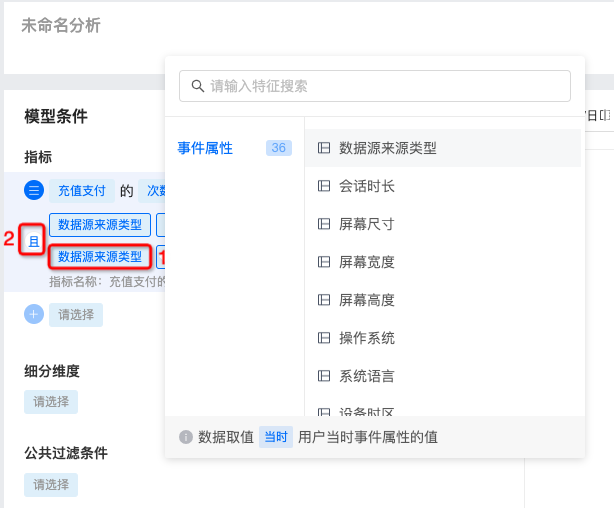
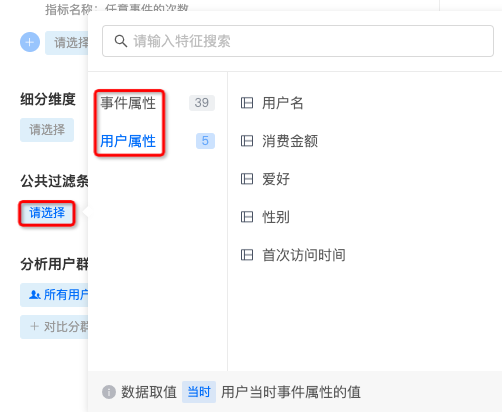
Click "Conditions" to add filter conditions. At 1, you can select the corresponding values of event attributes and user attributes.
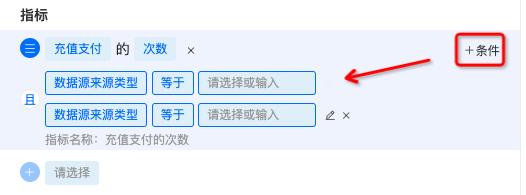
- If you add multiple filter conditions, click 2 places to switch the intersection and union relationship.
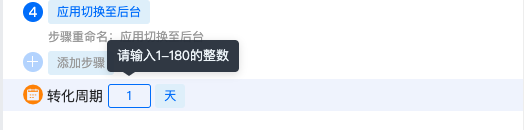
Set conversion cycle
The conversion cycle is the time period to complete the funnel, that is, the user needs to complete the first step to the last step within the specified window period. If the entire funnel conversion is completed within the window period, it will be recorded as a valid conversion, otherwise it will be recorded as a conversion loss of the corresponding event.
- By day, integer value range: [1,180], default is 1 day.
- Hourly, integer value range: [1,4320], default is 1 hour.
- By minute, integer value range: [1,259200], default 1 minute.
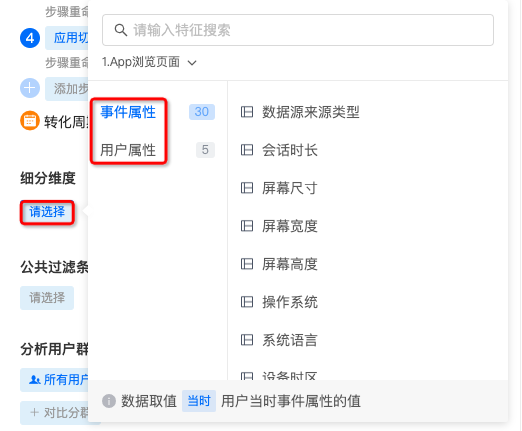
Select subdivision latitude
In order to provide more refined analysis, data analysis is supported through multiple dimensions. Dimensions refer to the angles from which things are analyzed. Event properties and user properties can be selected. Example: We can group user purchase channels to compare the number of users in different purchase channels.
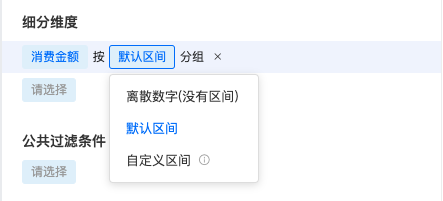
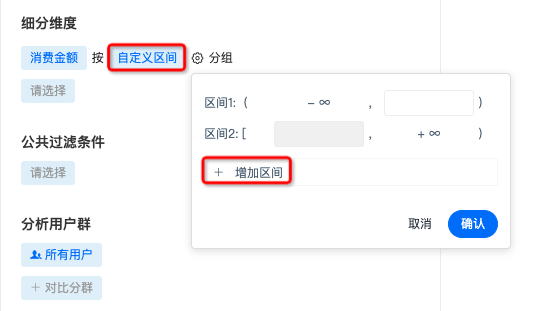
- Dimensions support the selection of discrete numbers, default intervals, and custom intervals. Custom intervals need to set the interval range, and support adding multiple intervals.
Set public filters
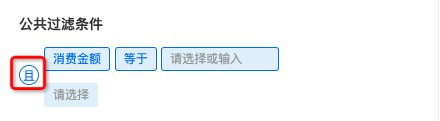
Conditional restrictions can be added to a single event, or public filtering conditions can be added to constrain multiple indicators. The condition is formed according to the structure of Attribute - Operator - Attribute value, and the attributes include two types: Event attributes and User attributes.
- Supports adding multiple filter conditions, the default is intersection relationship, click "and" to switch the intersection relationship.
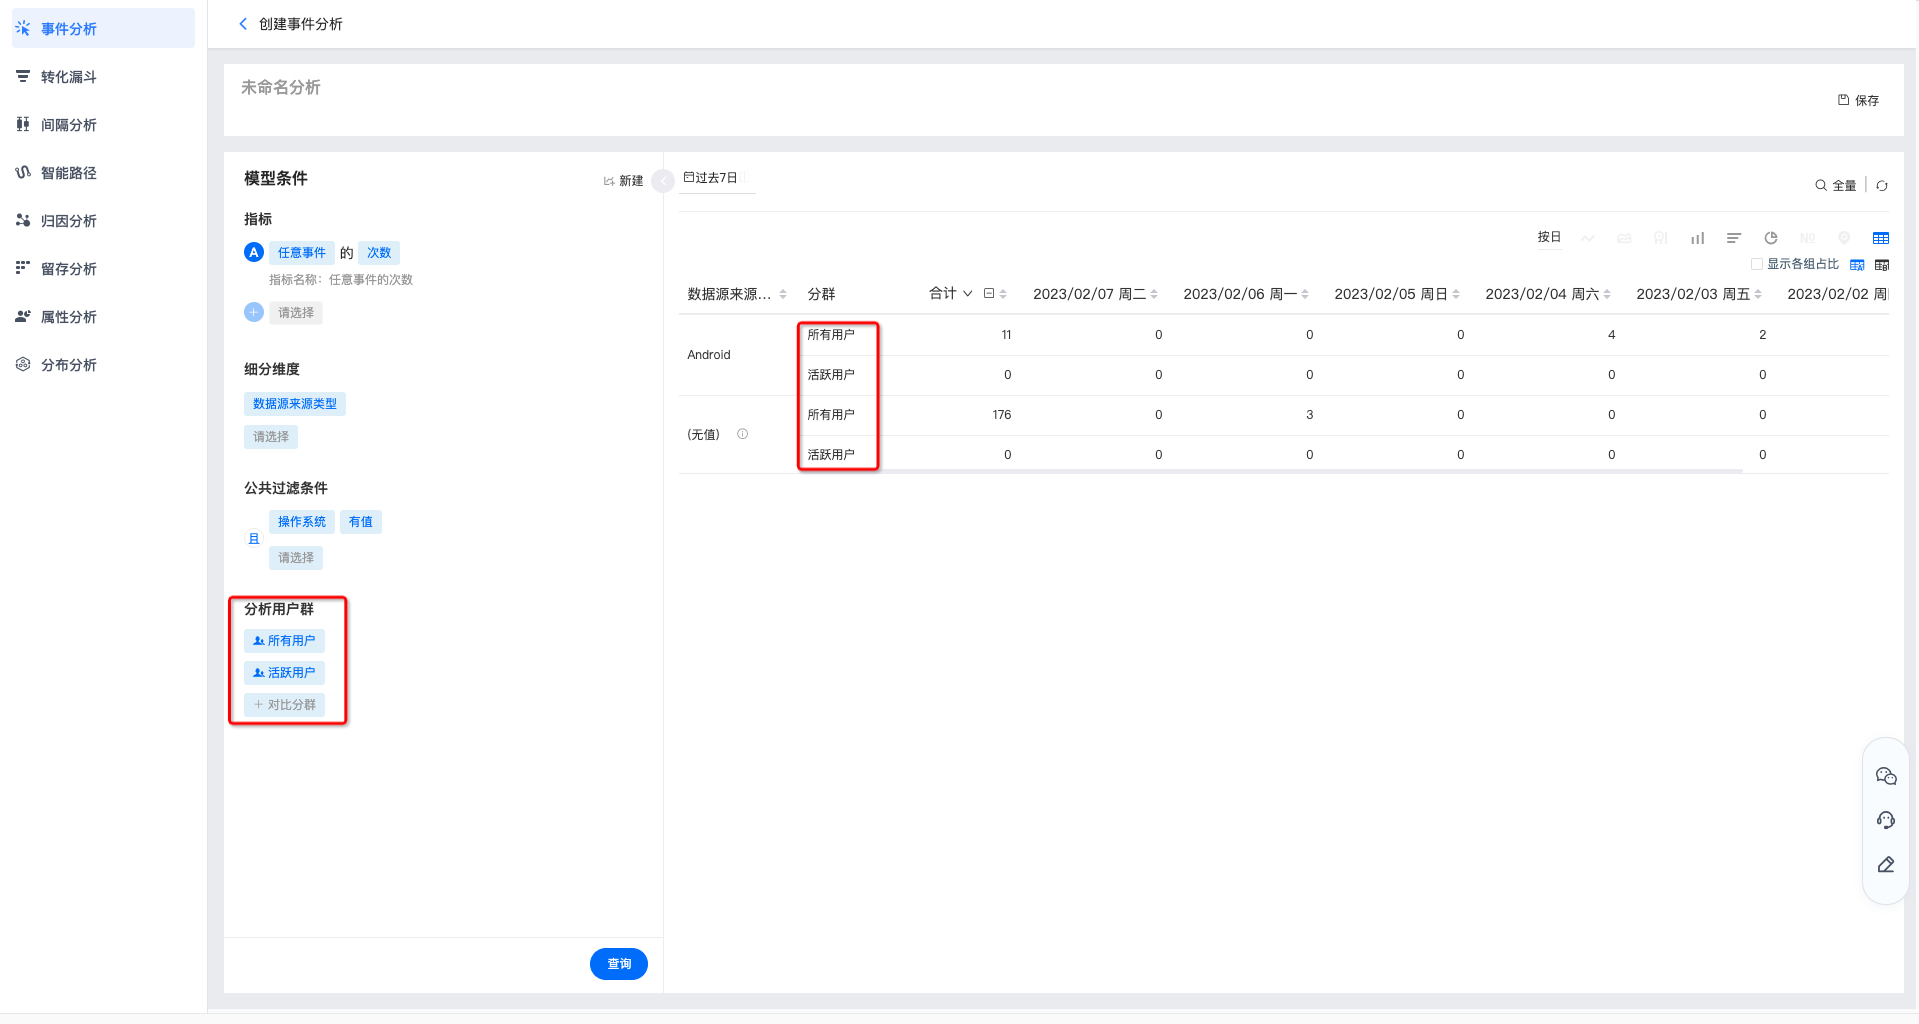
Select comparison group
JiguangThe analysis supports viewing indicators under a certain segmentation group, and also supports comparison among multiple groups.
Set up chart display
After setting up the funnel indicators, click "Query" to view the chart.
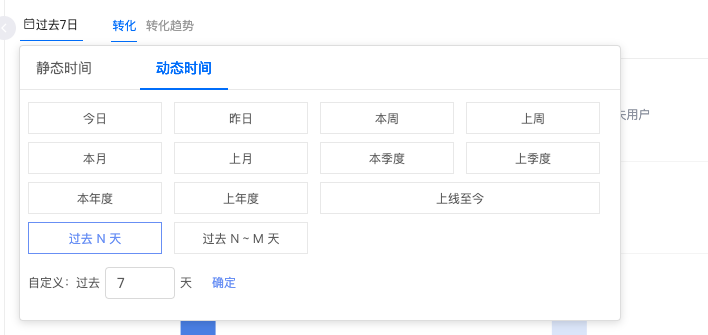
Select time range
- You can select common ranges such as the last 30 days, today, and last week, or you can customize the start time and end time on the right.
- When a relative time is selected to save the chart, the dynamic time range will be displayed during subsequent queries. For example, today is March 16, and if you select the query for the past 7 days, the query result is the data from March 9 to March 15; when you open the saved chart on March 21, the data you view will be from March 14 to March 20.
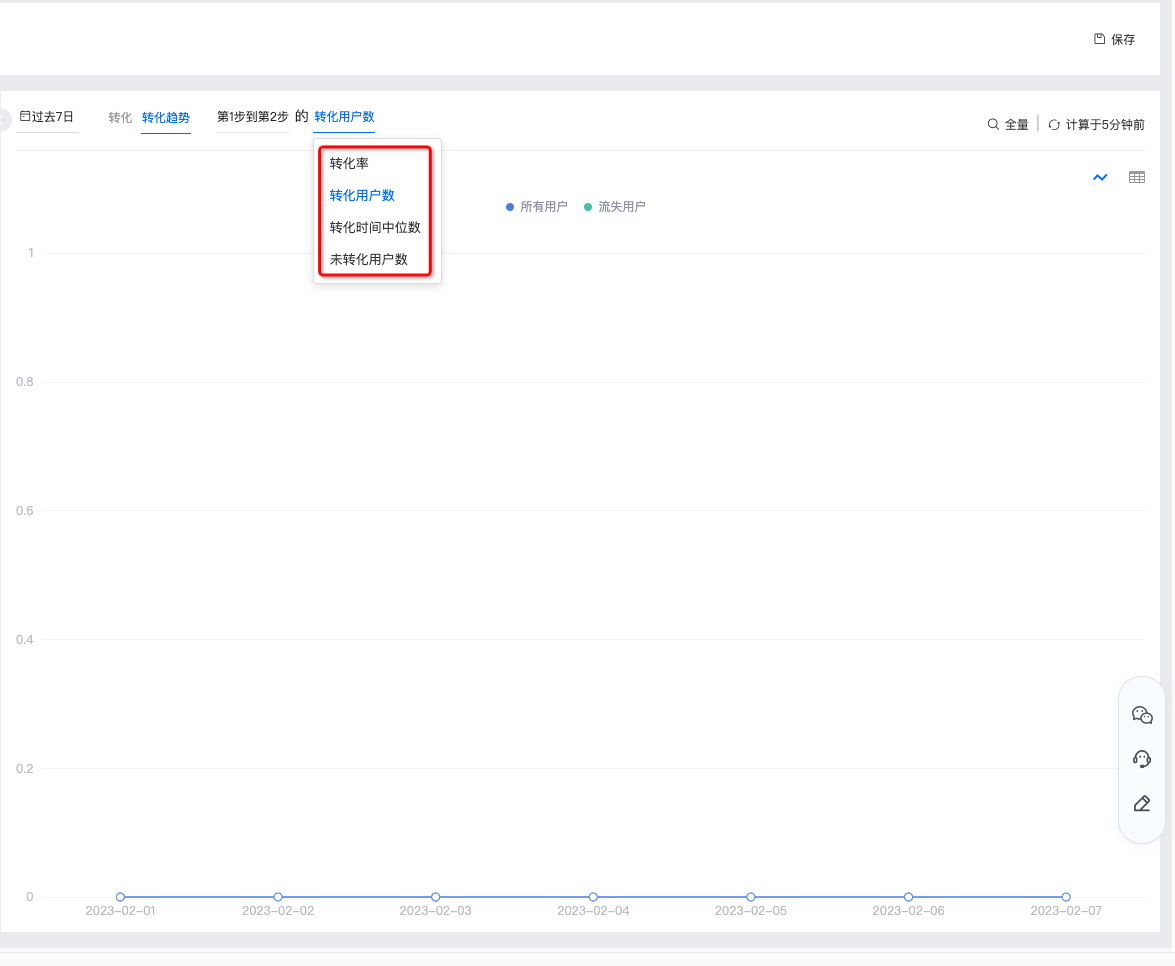
Conversion trends
Supports selecting "Conversion Trend" to view, and you can select overall, step 1 to step 2, and step 2 to step 3.

When selecting steps 1 to 2 or 2 to 3, you can choose to filter the conversion rate, number of converted users, median conversion time, and number of unconverted users.
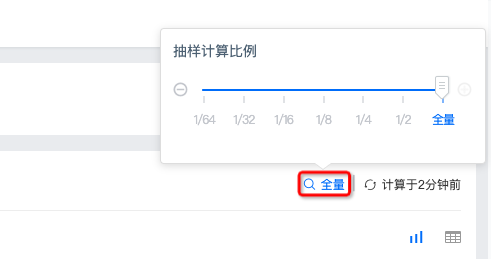
Set sampling calculation ratio
Supports setting the proportion of sampling calculation, the options are as follows:
Force refresh
The upper right corner will display the time point of the last refresh. If you need to view the current data, you can click to force refresh.
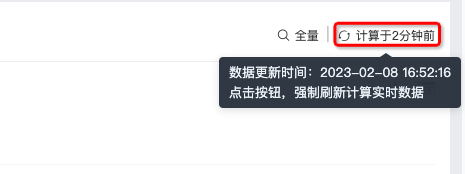
chart style
Displays the query results of different indicators, conditions, groups, and dimension combinations. The display styles include bar charts and data tables.
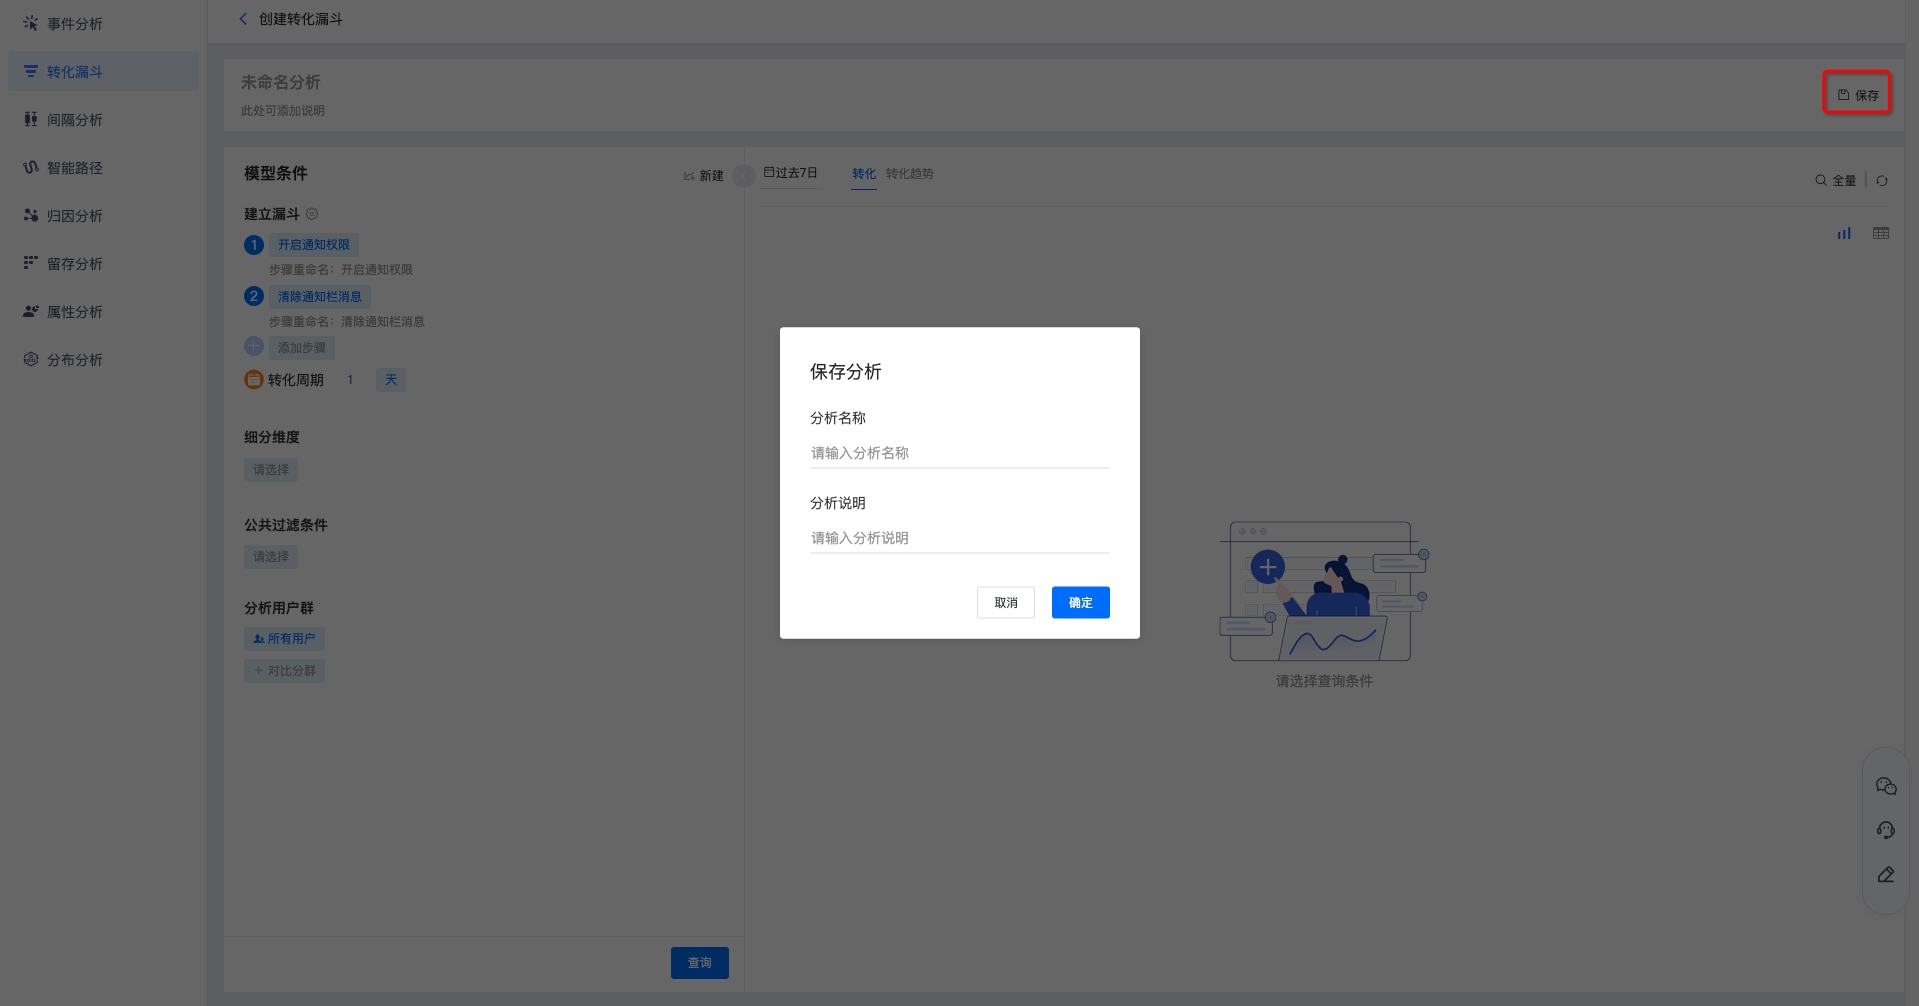
Save conversion funnel
Click "Save" in the upper right corner, fill in the chart name and chart description, and then view the calculation of this event on the main page of the conversion funnel.
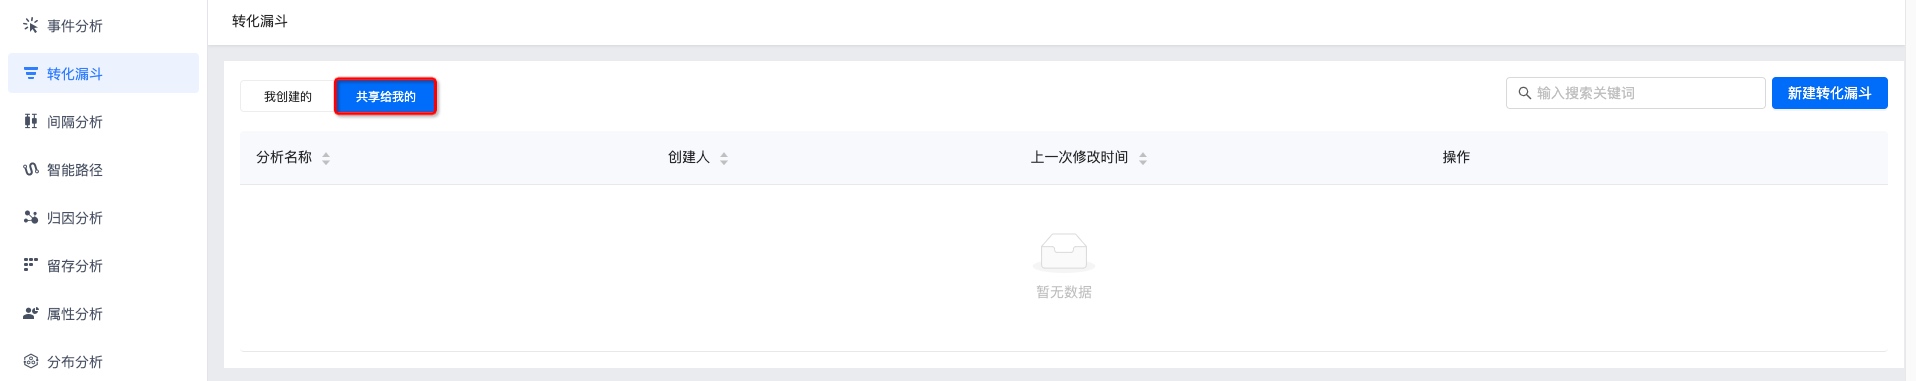
View conversion funnel
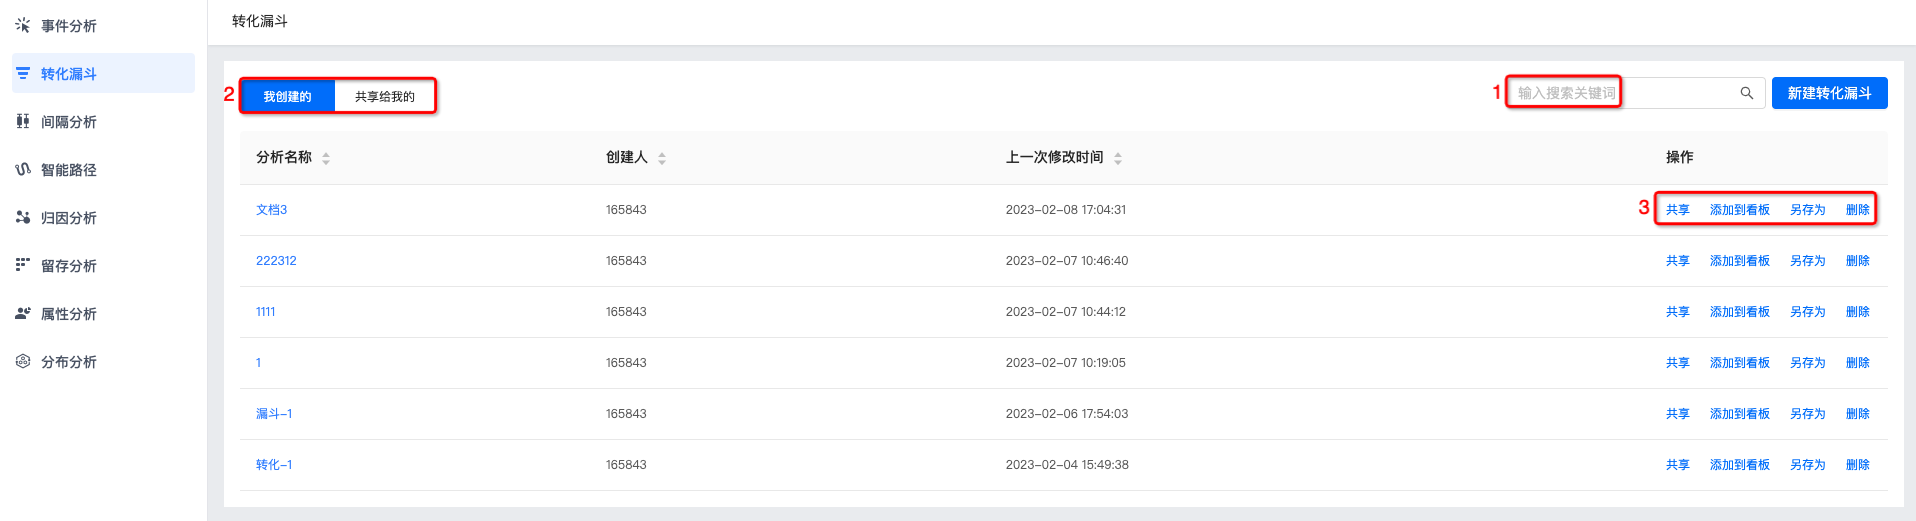
- Supports viewing the conversion funnels "created by me" and "shared with me". Click on the name of the conversion funnel to view the results of the conversion funnel.
- Support search box to search for conversion funnel name.
- Supports sharing, adding to the board, saving as, and deleting operations, please refer to the detailed instructions. Conversion funnel management。
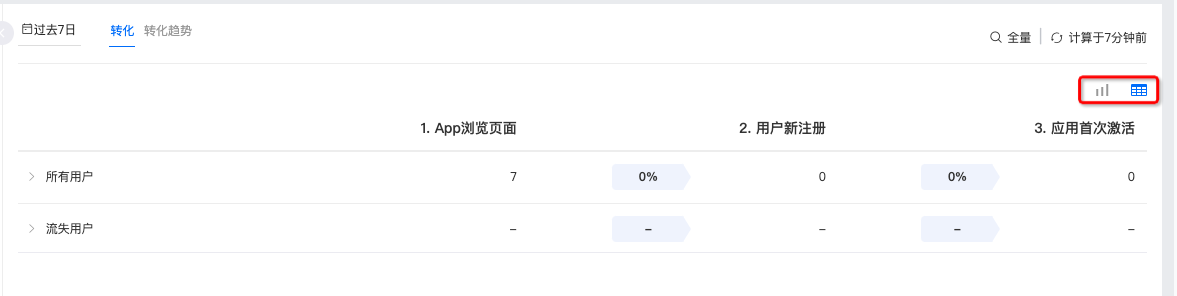
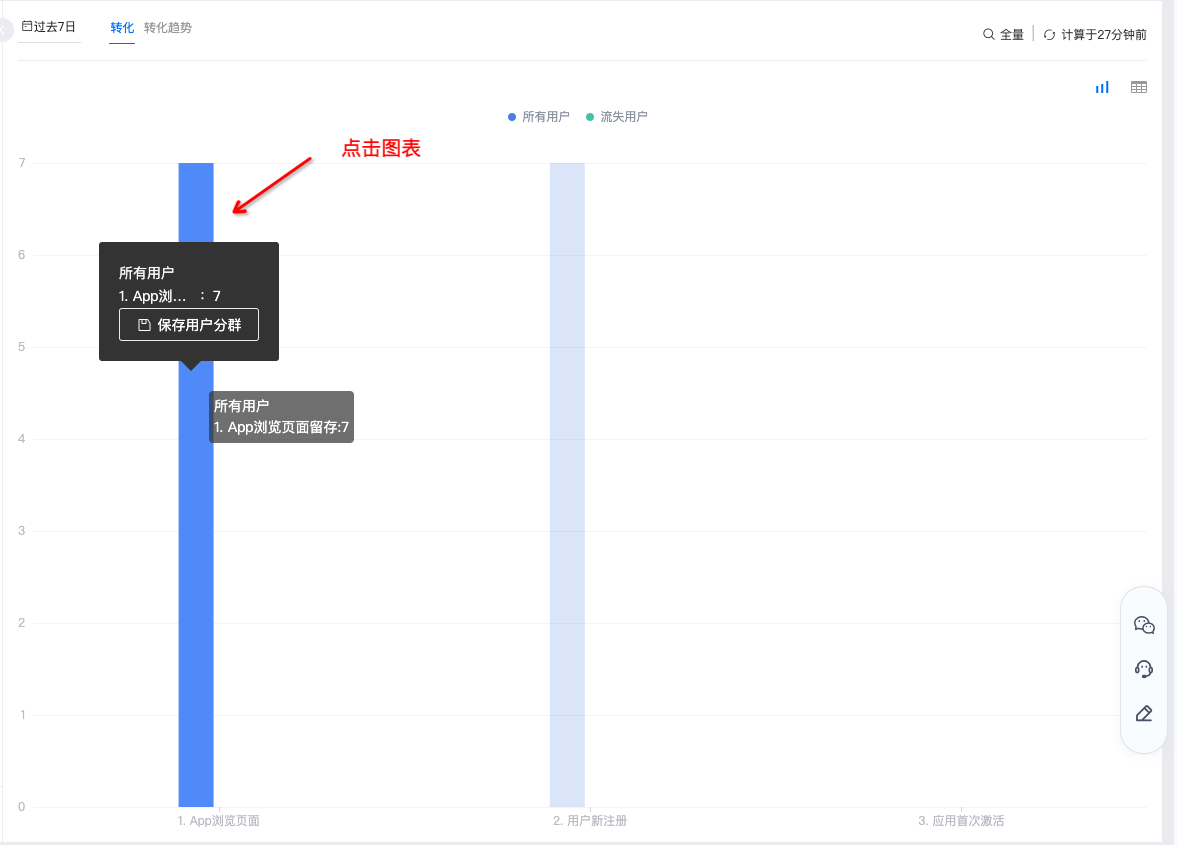
- The entire funnel conversion process is displayed in a funnel chart or data table, and you can see the conversion rate and number of people at each step.
- "Click on the chart - saveuser segment”, fill in the group name, description and select the group. Once confirmed, you can save it.user segment。
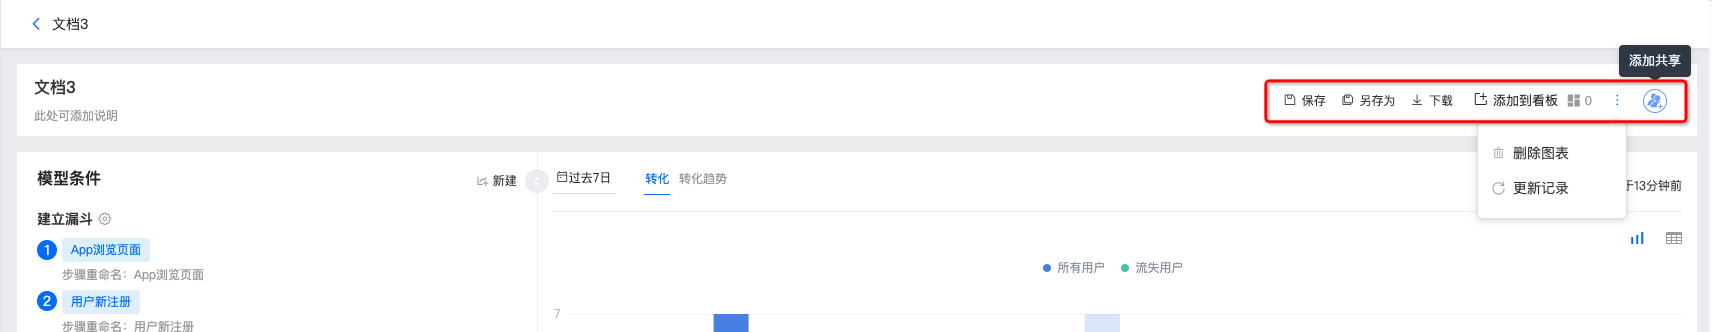
Conversion funnel management
Supports saving, saving as, downloading, adding to the board, referencing the chart's board, deleting the chart, viewing update records and adding sharing functions.
- After re-modifying the conversion funnel indicators, click "Save" to complete the update.
- If you need to create a copy of the conversion funnel, click "Save As", fill in the copy name and description, and save it.
- If you need to download conversion funnel data, click "Download". The download content includes the set indicators and detailed data.
- Click "Add to Board" to save it under "My Board-My Group".
- Click "Boards that reference this chart" to see which boards use this conversion funnel.
- Click "More-Delete Chart" and confirm twice to delete the chart.
- Click "More-Update Records" to view the operation log for updating the conversion funnel.
- Click "Add Sharing" to share the conversion funnel with other people. You can set it to be visible only to yourself, to all members in the project, and to designated members. Users who have been granted permissions can view it in the "Shared to Me" conversion funnel.
- All members in the project are visible: subsequent new members in the project will be added by default and given<仅查看>Roles can search for users and modify permissions individually.
- Specified members are visible: Certain users/roles can be searched to add permissions.