Smart Path
Path analysis analyzes users' behavioral paths when using a product. Product and operation teams can optimize product logic and improve operation strategies by analyzing user behavior and traffic transitions.
Applicable Scenarios
- Analyze common behavior paths of existing users, formulate best operating practices based on data results, and improve customer experience.
- Analyze the behavior paths of new users after entering the product and before leaving the product, discover issues that need improvement during first-time use, and optimize them.
- Analyze the conversion process of specific events. For example, if a user exits the page after placing an order but before paying, you can send corresponding operation pushes to this user group.
Create Path Analysis
Go to [Analysis Center] - [Path Analysis], and click "New".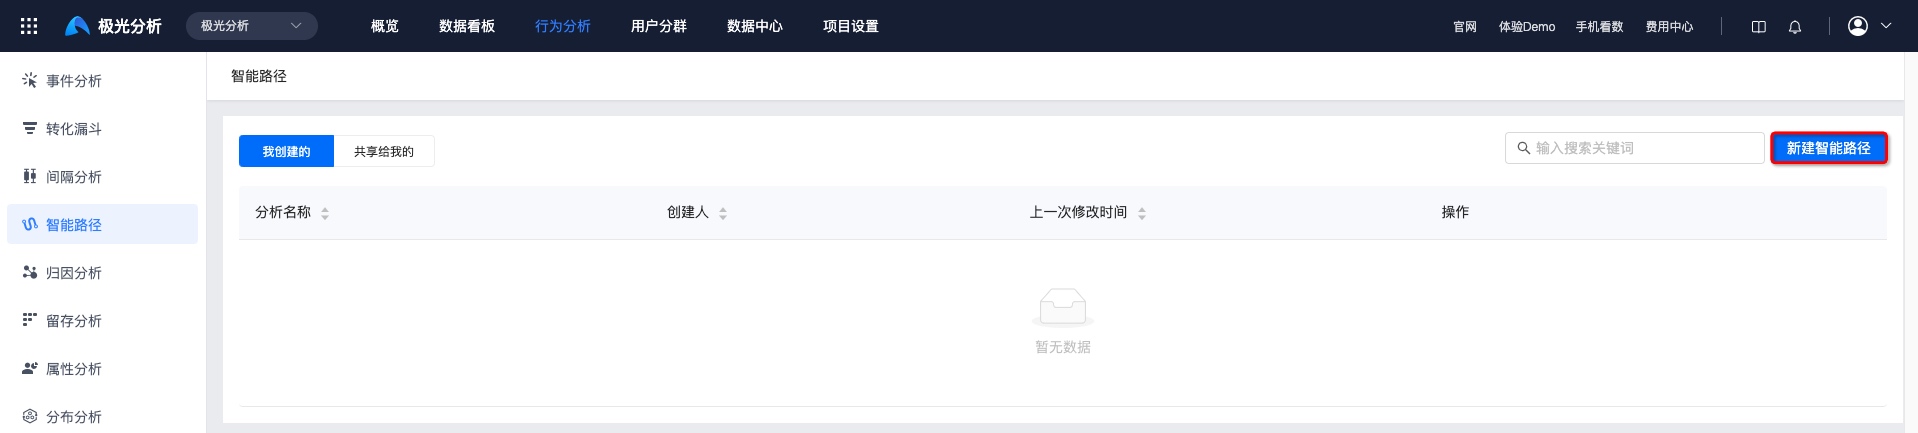
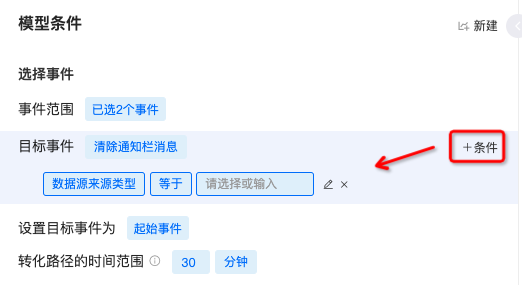
Select Events
In [Event Range - Select events whose paths need to be viewed], up to 10 analysis events are supported.
Meta events with reported data, virtual events, and all combined events are displayed in the event list.
Select one event within the event range as the target event. Filter conditions can be added.
Set the target event as the start event/end event.
Set the time range of the conversion path.
This indicates viewing behavior traces within a specified time period. When the target event is the start event, it means viewing behavior traces within the limited time period after the target event is triggered. When the target event is the end event, it means viewing behavior traces within the limited time period before the target event is triggered. For example, launch is the target start event and the time interval is 30 minutes. If a behavior sequence is launch-A-B......-Y-Z, and by the time X occurs more than 30 minutes have passed, then Y-Z is not included in the conversion path.
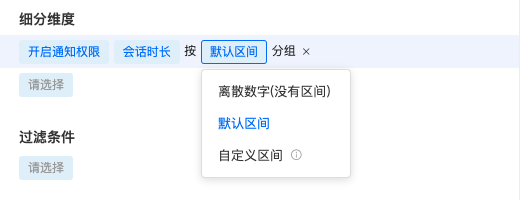
Select Segmentation Dimensions
To provide more detailed analysis, multiple dimensions are supported here for analyzing data. A dimension refers to an angle from which something is analyzed. You can select event properties and user properties of events. For example, we can group users by purchase channel to compare the number of users from different purchase channels.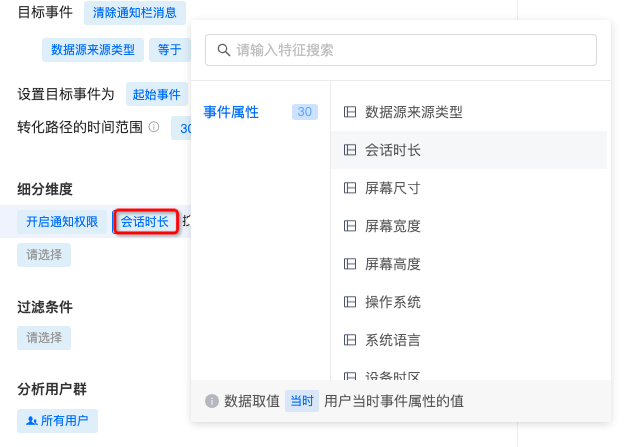
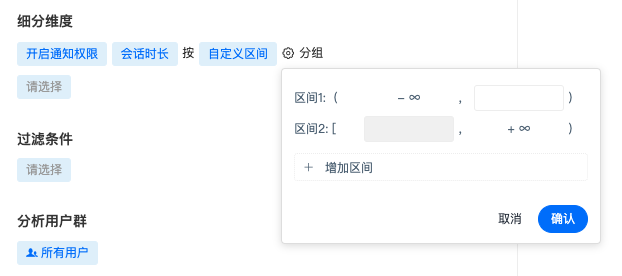
- Dimensions support discrete numbers, default intervals, and custom intervals. Custom intervals require setting interval ranges and support adding multiple intervals.
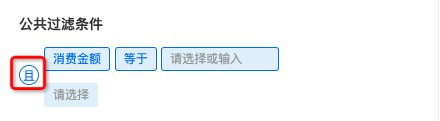
Set Common Filter Conditions
You can add condition restrictions for a single event, or add common filter conditions to constrain multiple metrics. Conditions are formed in the structure of property - operator - property value. Properties include event properties and user properties.
- Adding multiple filter conditions is supported. The default relationship is intersection. Click "AND" to switch between intersection and union relationships.
Select Analysis User Group
Jiguang Analytics supports viewing metrics under a segmented audience, and supports selecting preset audiences and custom user segments.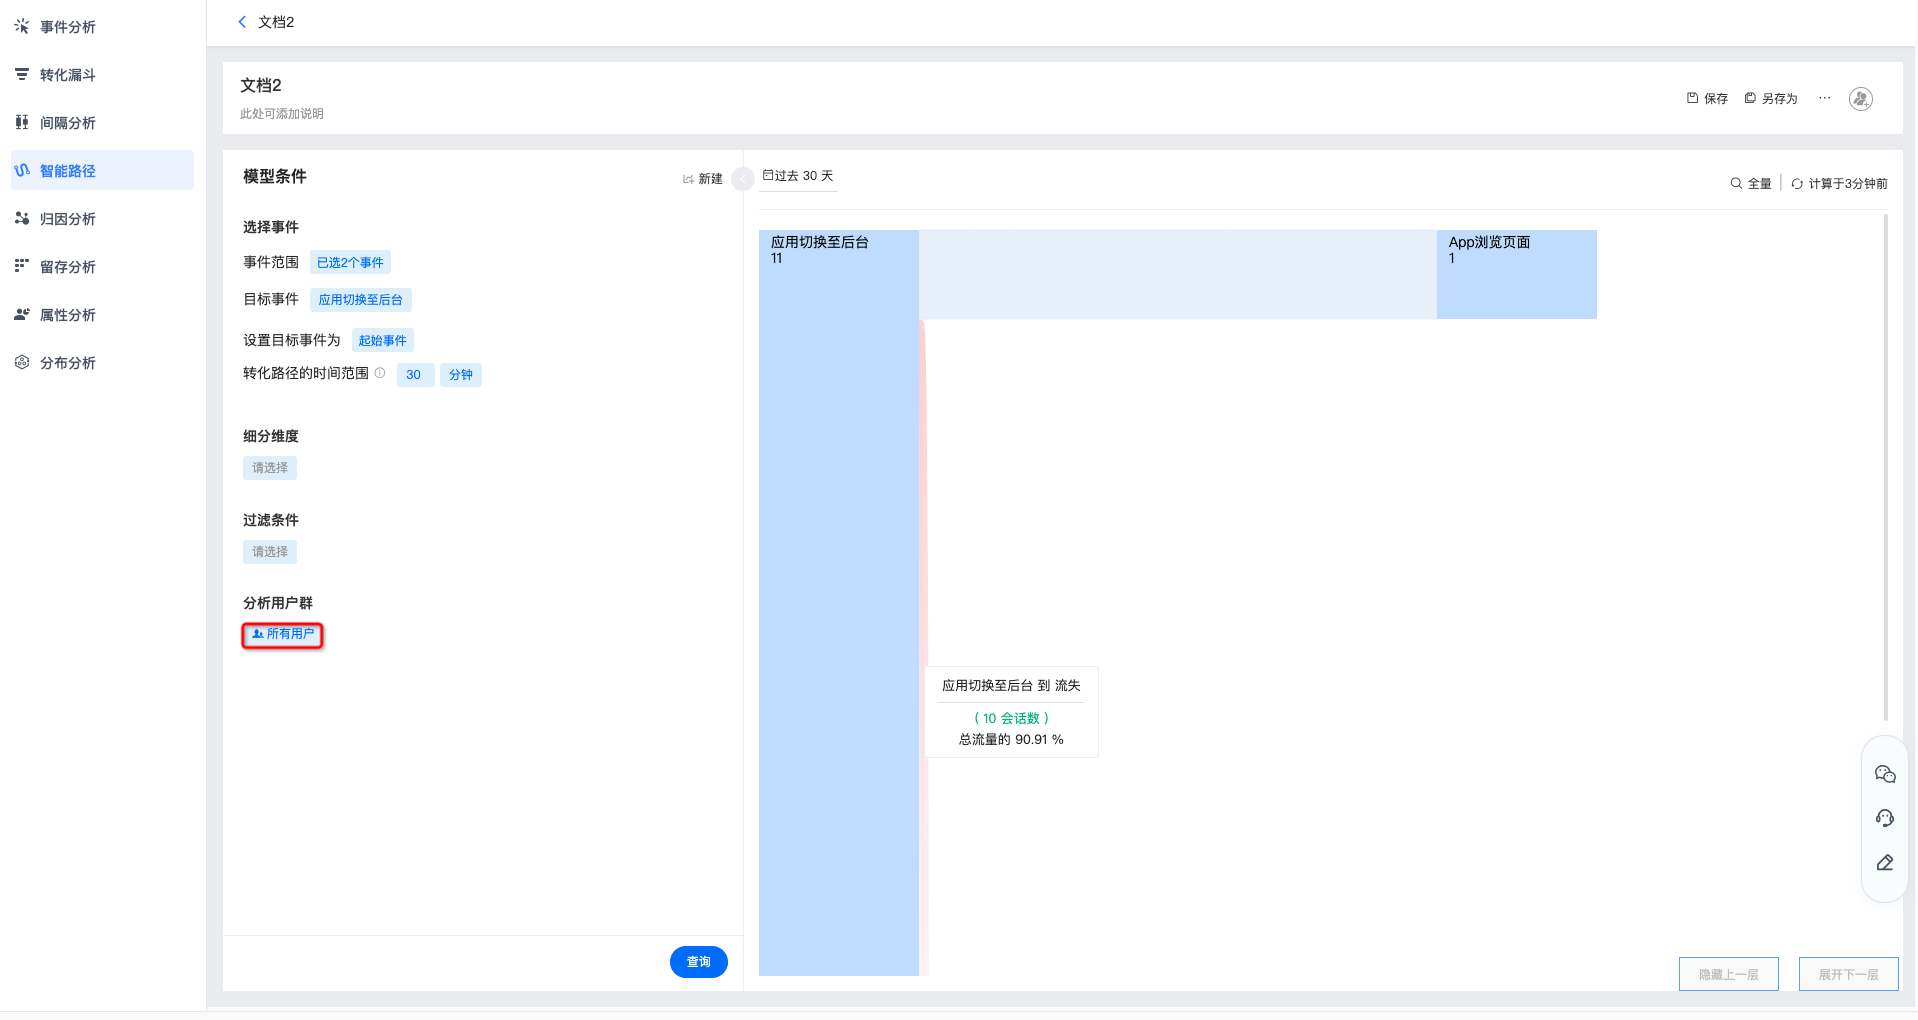
Set Chart Display
After setting event metrics, click "Query" to view the chart.
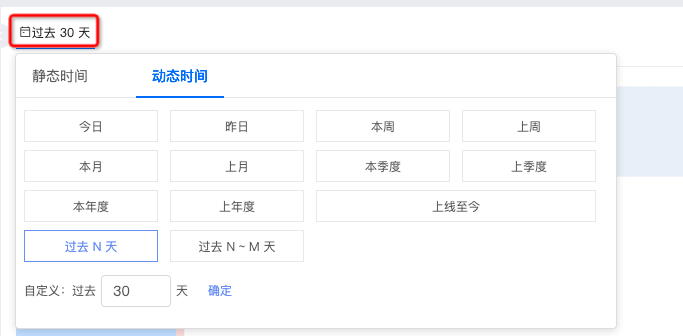
Select Time Range
- You can select common ranges such as the past 30 days, today, and last week, or customize the start time and end time on the right.
- When a chart is saved with a relative time selection, a dynamic time range is displayed in future queries. For example, if today is March 16 and you select the past 7 days, the query result is data from March 9 to March 15. When you open the saved chart on March 21, the displayed data will be from March 14 to March 20.
Set Sampling Calculation Ratio
Setting the sampling calculation ratio is supported. Options are as follows: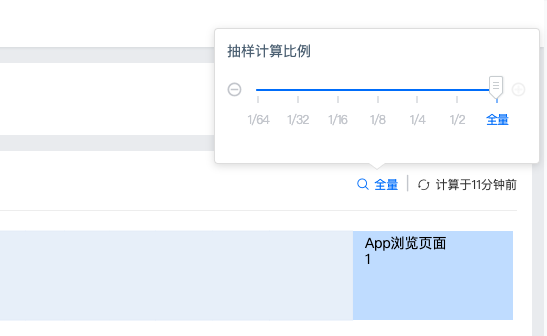
Force Refresh
The upper-right corner displays the time of the last refresh. If you need to view current data, click to force refresh.
Save Smart Path
Click "Save" in the upper-right corner. After filling in the chart name and chart description, you can view this path on the Smart Path main page.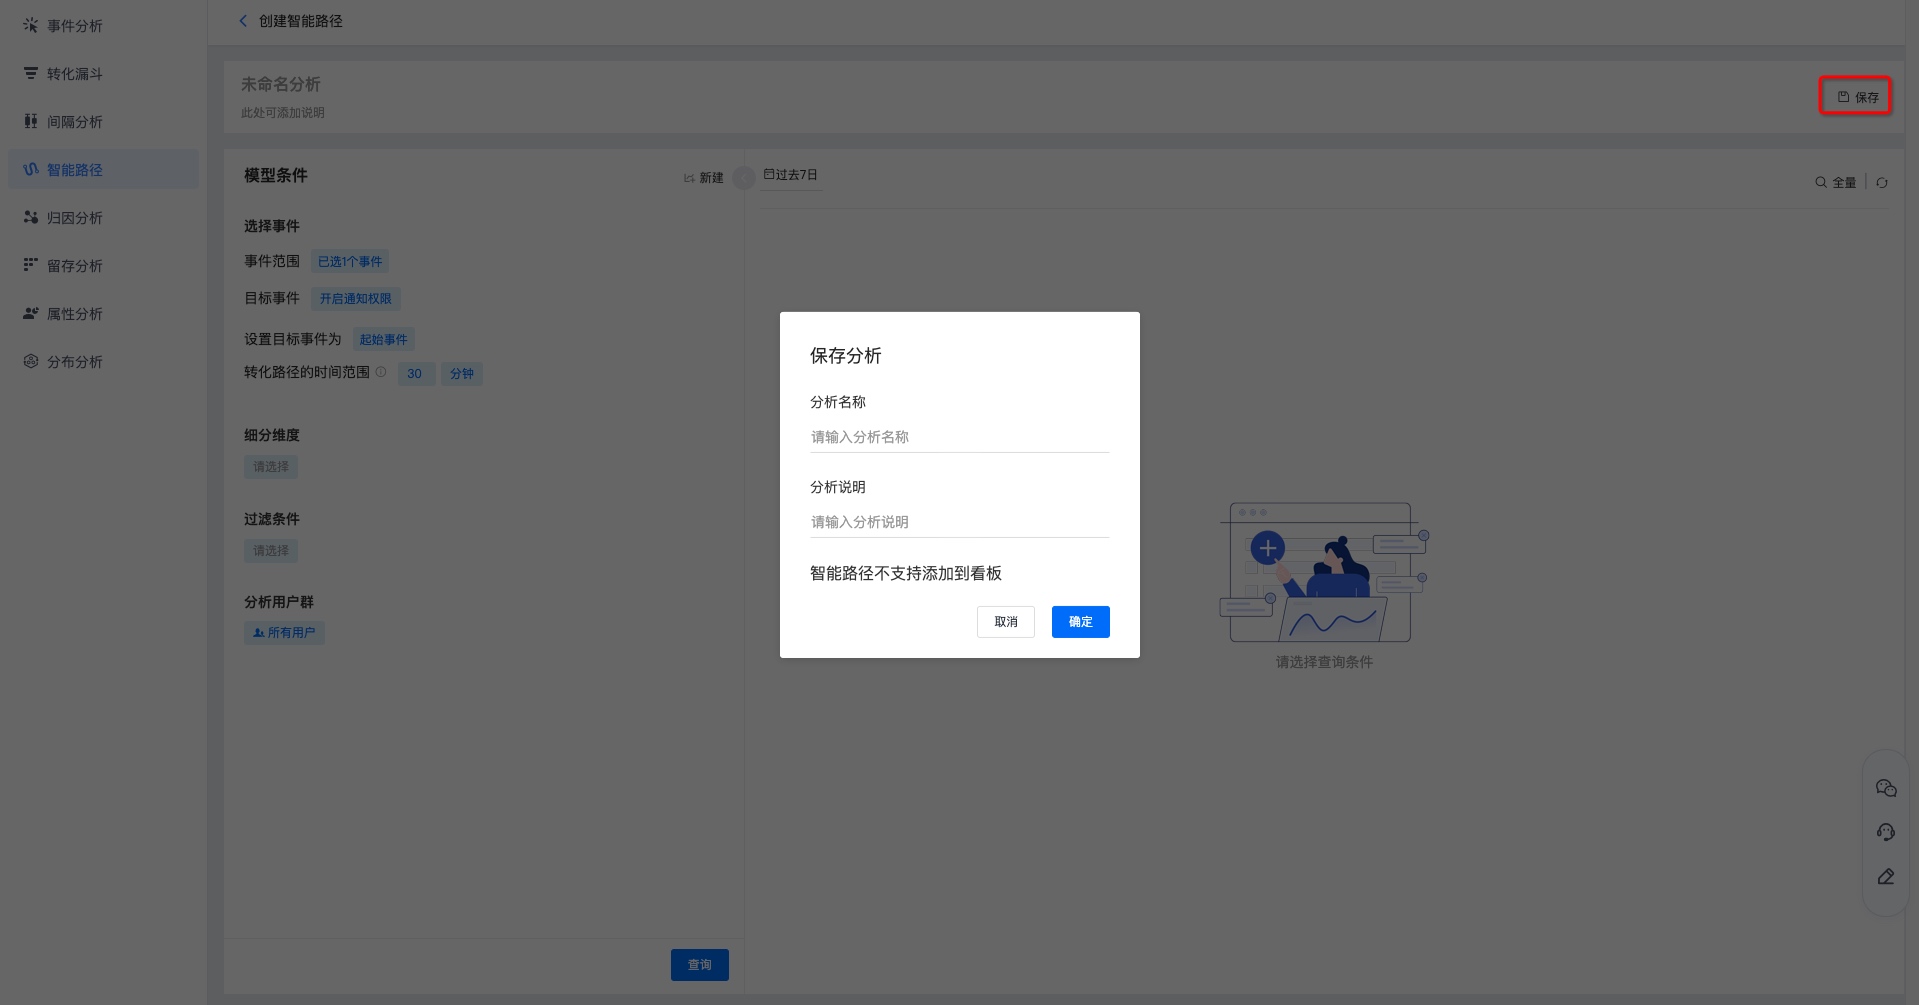
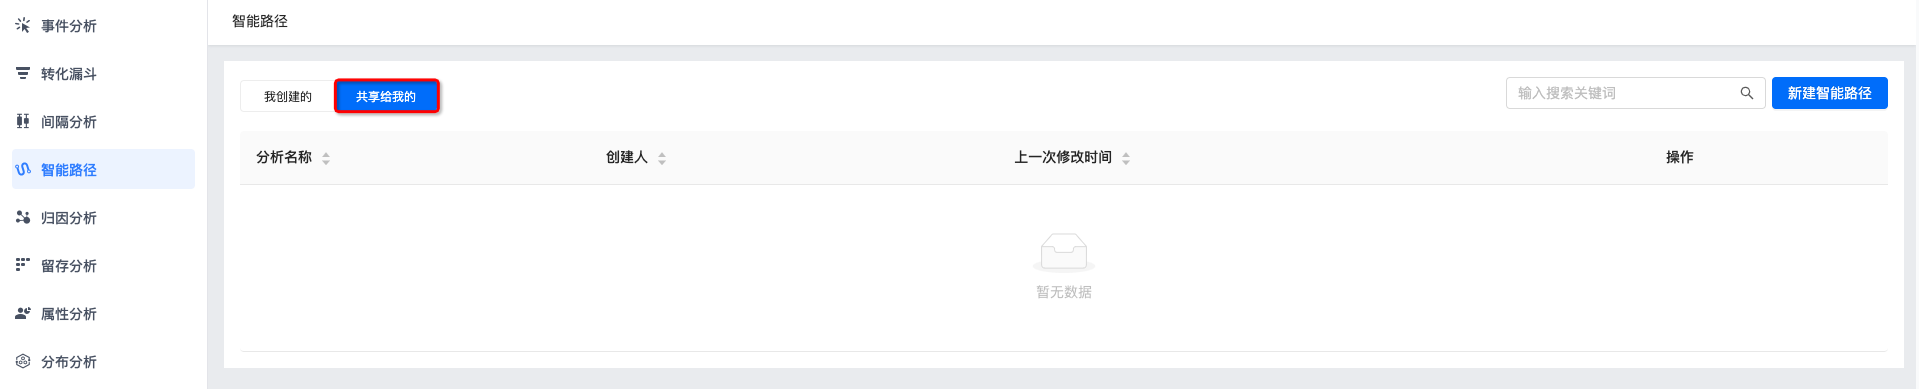
View Smart Path
Supports viewing smart paths "Created by Me" and "Shared with Me". Click the smart path name to view smart path results.
Searching smart path names in the search box is supported.
Sharing, adding to dashboard, saving as, and deleting are supported. For details, see Smart Path Management.

Smart Path Management
Supports saving, saving as, downloading, adding to dashboard, dashboards that reference this chart, deleting charts, viewing update records, and adding sharing.
After modifying the metrics of the smart path again, click "Save" to complete the update.
To create a copy of a smart path, click "Save As", fill in the copy name and description, and save it.
Click [More - Delete Chart], and delete the chart after secondary confirmation.
Click [More - Update Records] to view operation logs for updating this smart path.
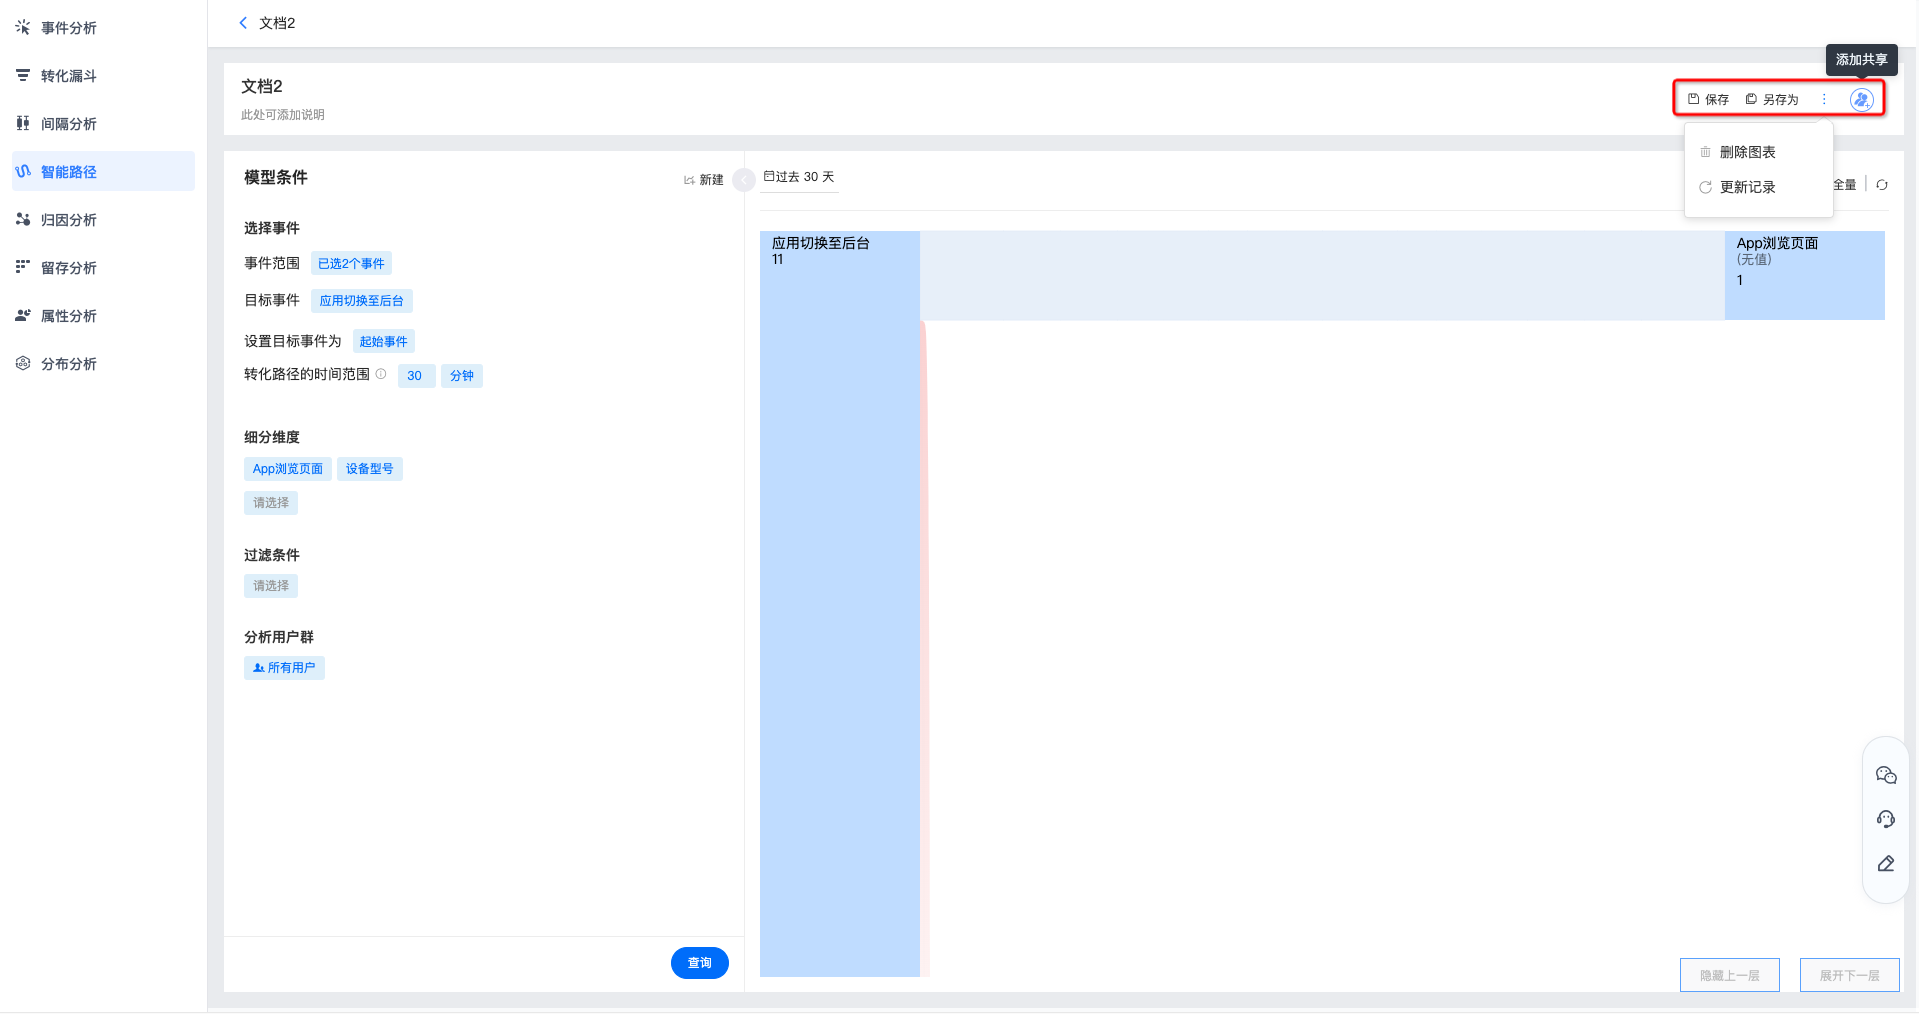
Click "Add Sharing" to share this smart path with others. Supports setting visibility to only myself, all members in the project, and specified members. Users granted permissions can view it in smart paths under [Shared with Me].
Visible to all members in the project: new members added to the project later will be included by default and assigned the
role. You can search for users to modify permissions separately. Visible to specified members: you can search and add specific users/roles and grant permissions.