Attribution Analysis
Attribution analysis is mainly used to measure and evaluate the contribution of in-app user touchpoints to the achievement of overall conversion goals, such as total order amount. The core evaluation metric is "conversion contribution".
A touchpoint is a contact point where users interact with the product, such as operation placements, search, and navigation. These touchpoints guide user behavior and promote user conversion.
Overview
When running operation campaigns, operators may place campaign materials in multiple operation placements within the product, trying to attract users' attention at each touchpoint during the interaction between users and the product, guide traffic flow and user behavior, and drive final conversion.
In addition, users may also obtain information through touchpoints such as search and content recommendations, and these touchpoints also play an important role in whether users can complete conversions. In other words, on the user's conversion path, many in-app touchpoints participate in persuading and guiding users and affect users' final decisions.
So, compared with each user touchpoint, how much does each contribute to the achievement of key metrics? Do they all have excellent conversion capabilities as expected by operators, or are some underestimated? How should the weight allocation of resources for each operation placement be adjusted in future operations?
For the above questions, attribution analysis provides an intuitive measurement: conversion contribution, which can directly quantify the conversion effect and value contribution of each operation placement and each touchpoint.
By combining attribution analysis with features such as funnel analysis, you can compare and analyze the conversion capabilities of each operation placement more comprehensively, maximize product value through adjustments to operation resource allocation, and improve product data and operation metrics.
Feature Description
With a few simple settings, you can intuitively see how each touchpoint contributes to the overall conversion metric.
- Define the conversion goal: target event.
- Define user touchpoints: touchpoint events.
- Select an attribution model: Jiguang Analytics currently provides five common attribution models.
- Define the window period: the time limit for a user to complete one conversion.
- Select the query time range: the time range in which the target event occurs.
Create Attribution Analysis
Go to [Analysis Center] - [Attribution Analysis], and click "New".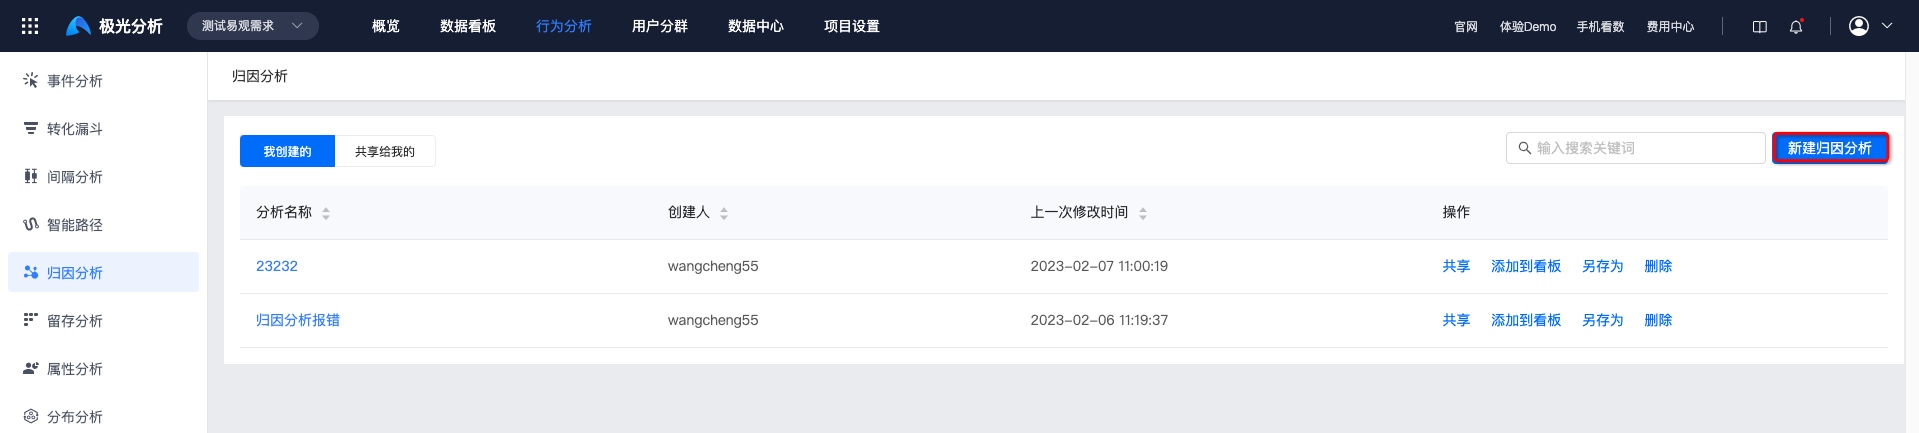
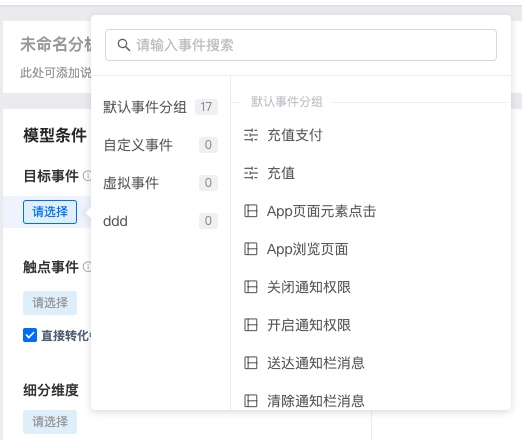
Set Target Event
Target event: the conversion goal event of an operation campaign, such as claiming a coupon or purchasing a product.
Steps
Click "Any Event" and add the event to analyze.
Meta events with reported data, virtual events, and all combined events are displayed in the event list.
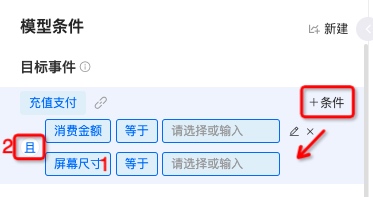
Set the forward associated event of the target event:
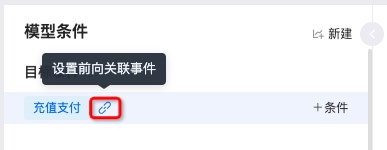
- A forward associated event refers to an event that occurs before the target event and is highly related to the conversion goal. It acts as a bridge and link in promoting users to complete the conversion goal.
- By setting forward associated events, you can further precisely define a conversion, more accurately trace and restore the user's conversion path, and improve the attribution model's accuracy.
- A forward associated event is not necessarily the immediately previous action before the user completes the target event, but it must occur after the touchpoint event and before the target event. For example, in an e-commerce app, before a user places an order and purchases a product, they usually perform actions such as "view product detail page" and "add to cart". We can treat these two events as forward associated events highly related to the "purchase product" event.
- Through "associated properties", the effective conditions of forward associated events can be defined more precisely: when a shared property value of the forward associated event and the target event is equal, the definition of the forward associated event takes effect.
- Click "Condition" to add filter conditions. At position 1, you can select corresponding values of event properties and user properties. If multiple filter conditions are added, click position 2 to switch the intersection/union relationship.
Set Touchpoint Events
- Touchpoint event: an event intended to guide user traffic and drive final conversion, such as clicking the first-focus banner.
- Direct conversion: a conversion in which the target event is triggered but no touchpoint event is triggered. It is regarded as a direct conversion.
Steps
- Click "Please Select" to select touchpoint events. Multiple events can be selected.

2. Click "Condition" to add filter conditions. At position 1, you can select corresponding values of event properties and user properties. If multiple filter conditions are added, click position 2 to switch the intersection/union relationship.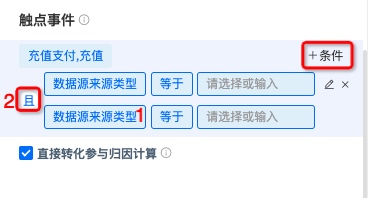
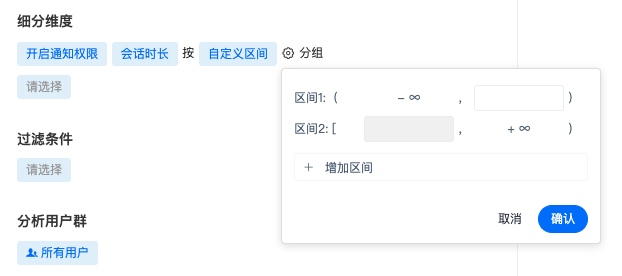
Select Segmentation Dimensions
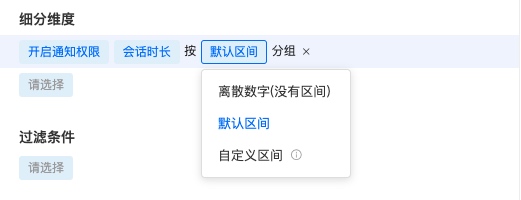
By using segmentation dimensions, touchpoint events with different dimension values are regarded as finer-grained user touchpoints. Different grouping methods are supported for different property value types.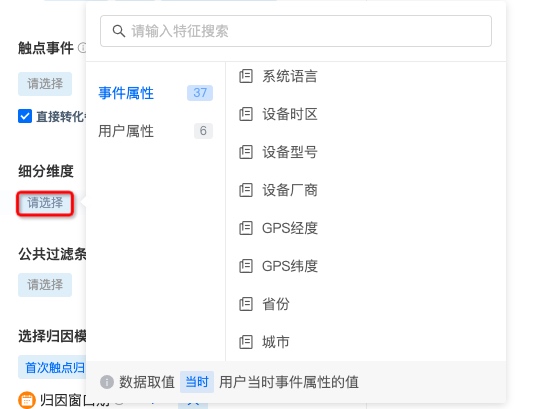
- Dimensions support discrete numbers, default intervals, and custom intervals. Custom intervals require setting interval ranges and support adding multiple intervals.
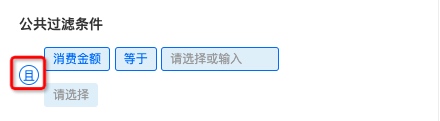
Set Common Filter Conditions
You can add condition restrictions for a single event, or add common filter conditions to constrain multiple metrics. Conditions are formed in the structure of property - operator - property value. Properties include event properties and user properties.
- Adding multiple filter conditions is supported. The default relationship is intersection. Click "AND" to switch between intersection and union relationships.
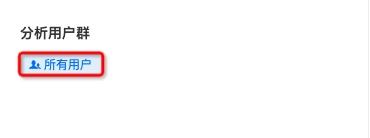
Select Analysis User Group
Jiguang Analytics supports viewing metrics under a segmented audience, and supports selecting preset audiences and custom user segments.
!
Select Attribution Model
From the first time a user encounters operation messages published in the product and interacts with operation placements, to finally completing conversion, the entire conversion path may pass through multiple touchpoints. On the user's conversion path, each touchpoint has different contribution weight to conversion. You can select the corresponding attribution model based on specific business scenarios and analysis requirements.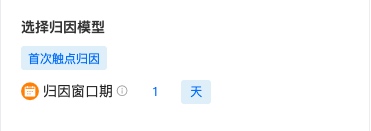
Currently, Jiguang Analytics provides 5 attribution models. See the following table for model descriptions:
| Model | Model Description |
|---|---|
| First-touch attribution | Assigns 100% of conversion credit to the first interacted event to be attributed |
| Last-touch attribution | Assigns 100% of conversion credit to the last interacted event to be attributed |
| Linear attribution | Evenly distributes conversion credit to all events to be attributed on the conversion path |
| Position-based attribution | Distributes conversion credit based on the position of the event to be attributed on the conversion path. Usually, the first and last interaction events each receive 40%, and the middle touchpoint events share the remaining 20% evenly |
| Time decay attribution | Distributes conversion credit based on the chronological order in which events to be attributed occur. The closer an event is to the target event time, the greater its contribution and the more credit it receives |
Set Window Period
The window period is the time limit from triggering a touchpoint event to triggering the target event and completing one target conversion.
Set Chart Display
After setting event metrics, click "Query" to view the chart.
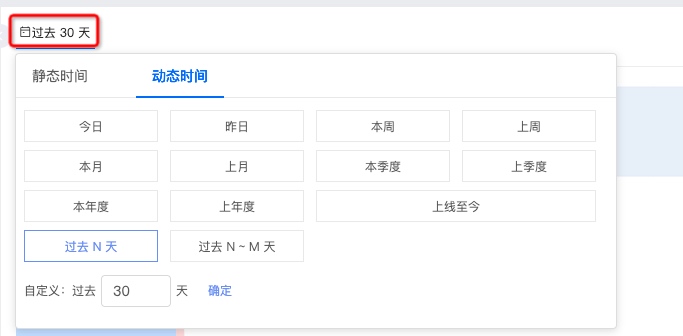
Select Time Range
- You can select common ranges such as the past 30 days, today, and last week, or customize the start time and end time on the right.
- When a chart is saved with a relative time selection, a dynamic time range is displayed in future queries. For example, if today is March 16 and you select the past 7 days, the query result is data from March 9 to March 15. When you open the saved chart on March 21, the displayed data will be from March 14 to March 20.
Set Sampling Calculation Ratio
Setting the sampling calculation ratio is supported. Options are as follows: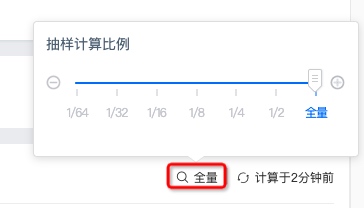
Force Refresh
The upper-right corner displays the time of the last refresh. If you need to view current data, click to force refresh.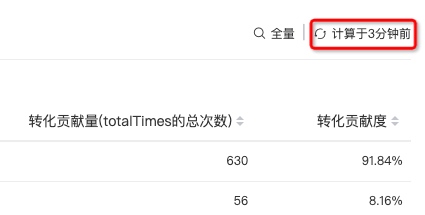
Save Attribution Analysis
Click "Save" in the upper-right corner. After filling in the chart name and chart description, you can view this path on the Attribution Analysis main page.
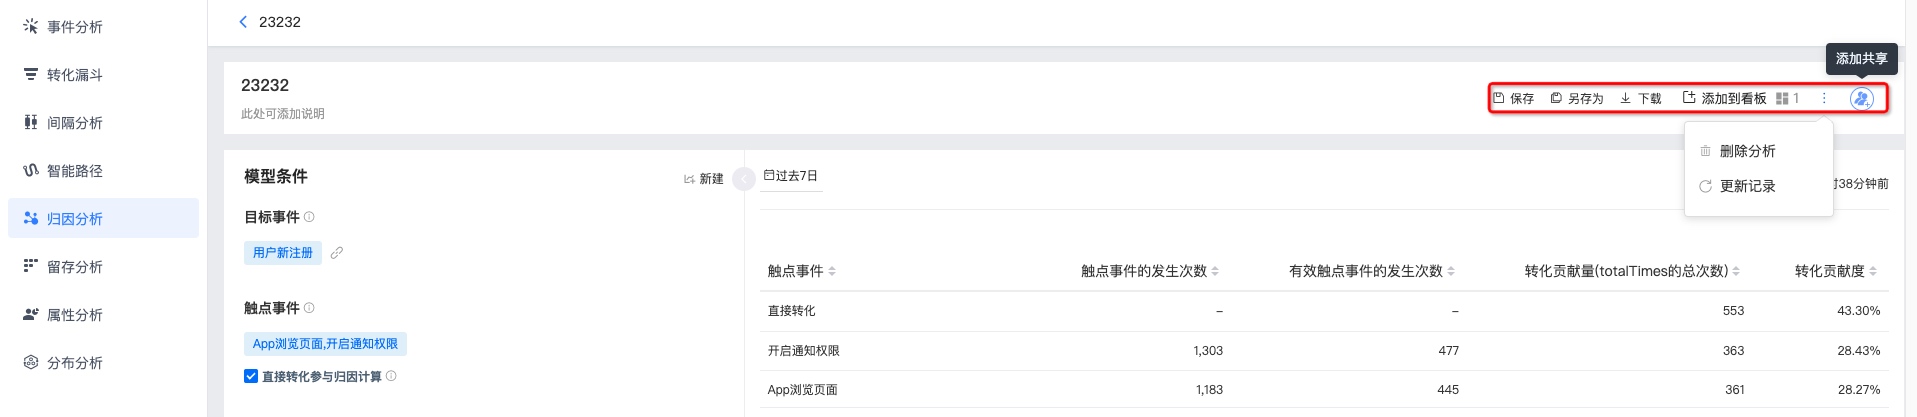
Query Result Description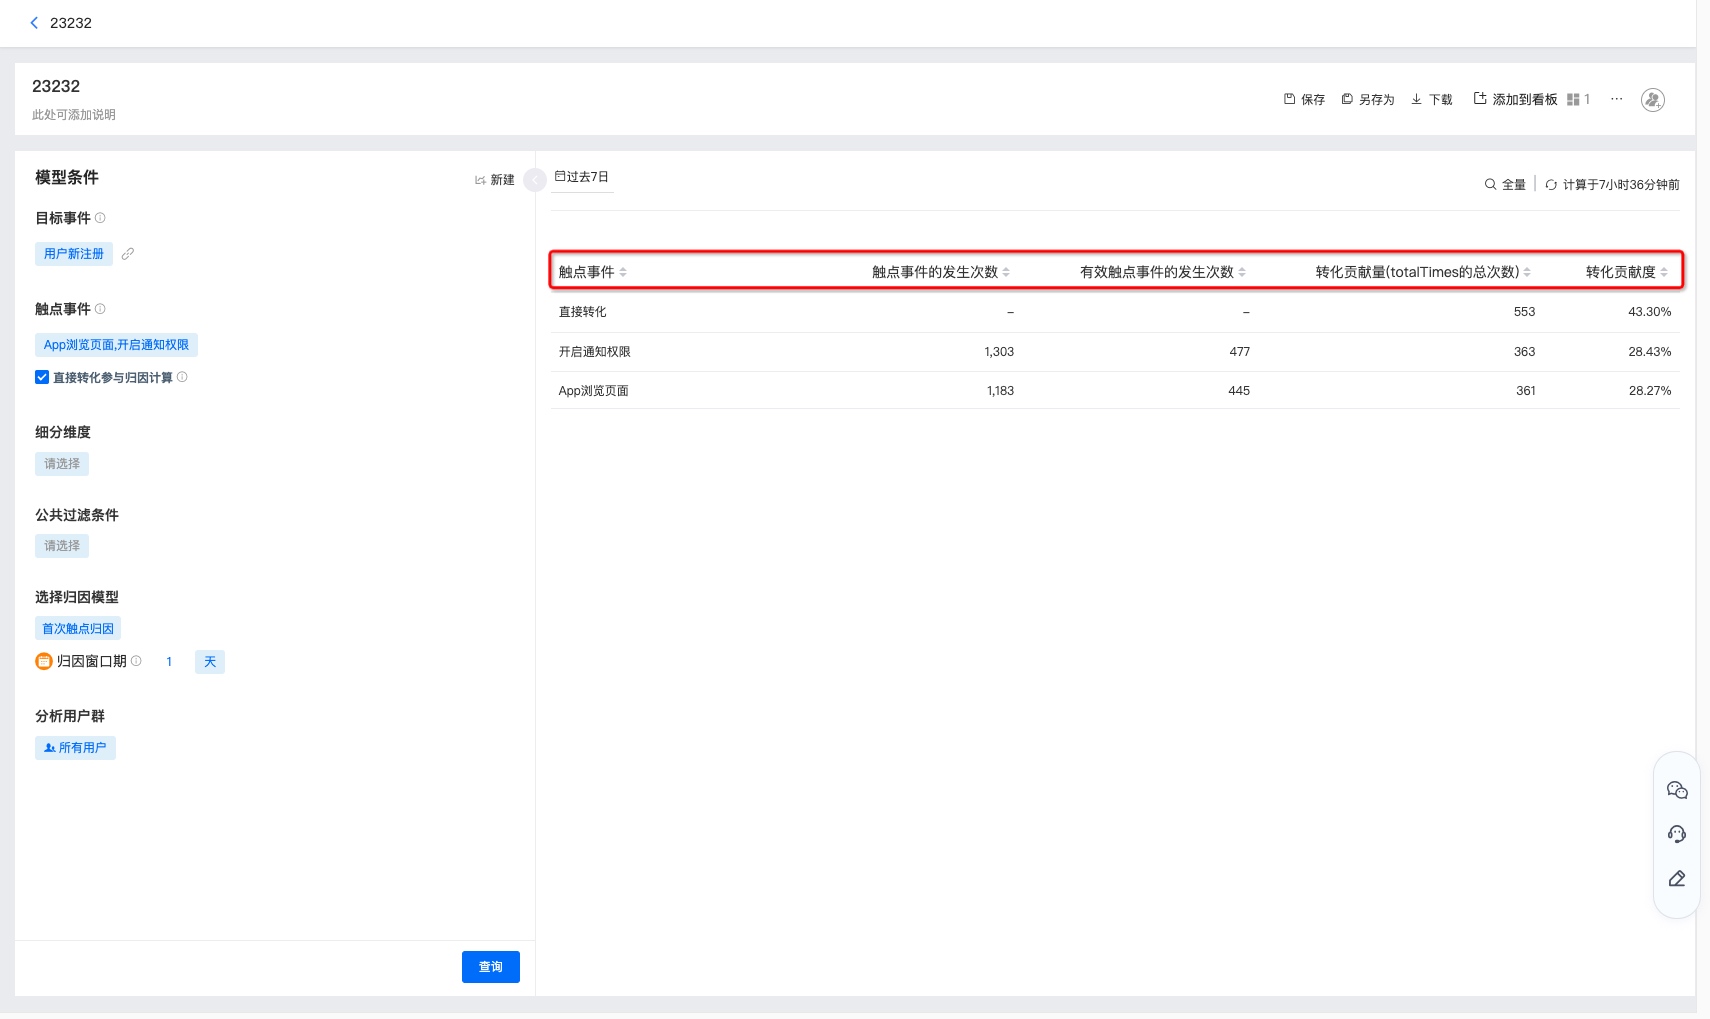
The data items and metric meanings in the result table are shown below:
| Metric | Metric Meaning |
|---|---|
| Occurrences of touchpoint event | Number of occurrences of the touchpoint event within the statistical range |
| Occurrences of effective touchpoint event | Within the statistical range, a touchpoint that brings conversion is an effective touchpoint event |
| Conversion contribution | Contribution of the touchpoint event to the total conversion metric within the statistical range |
| Conversion contribution amount | Contribution amount of the touchpoint event to the total conversion metric, such as total number of target events, within the statistical range Conversion contribution amount = overall conversion amount * conversion contribution |
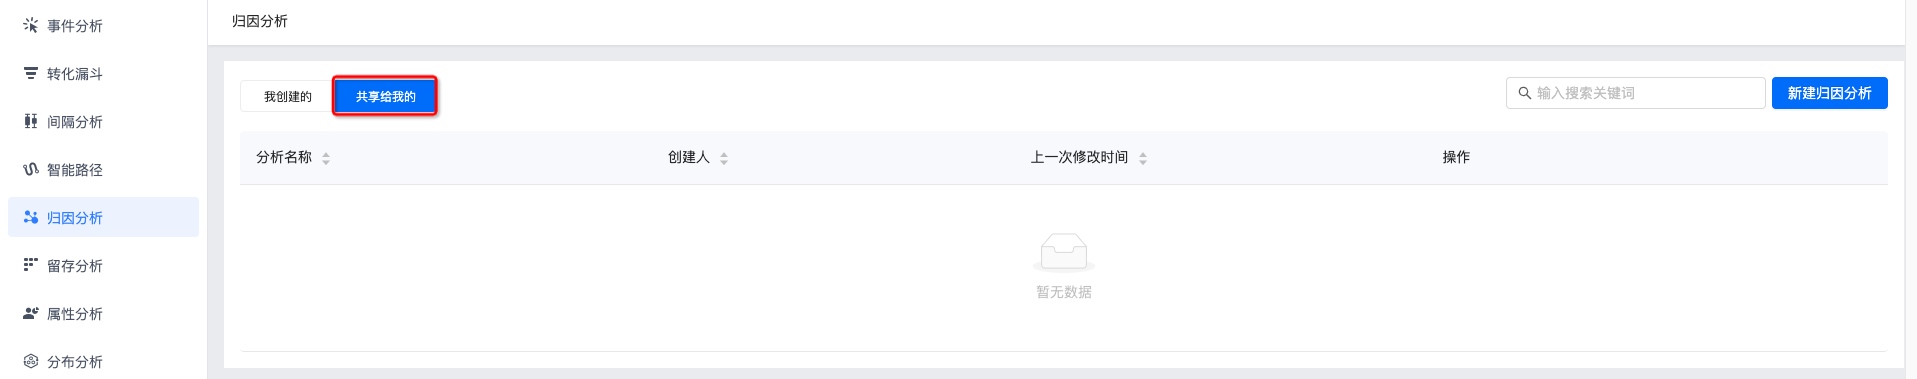
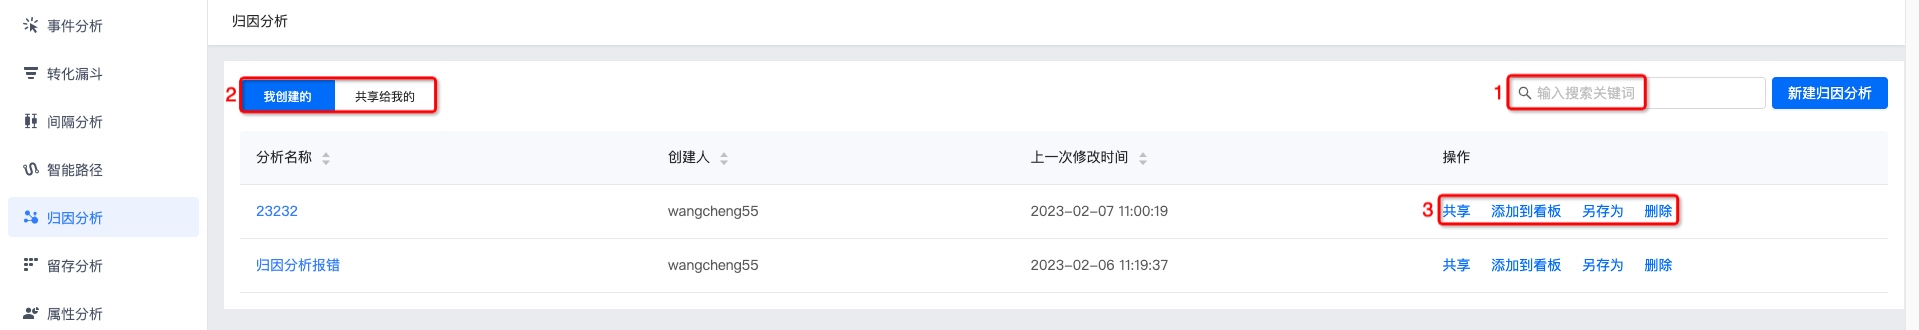
View Attribution Analysis
- Supports viewing attribution analyses "Created by Me" and "Shared with Me". Click the attribution analysis name to view attribution analysis results.
- Searching attribution analysis names in the search box is supported.
- Sharing, adding to dashboard, saving as, and deleting are supported. For details, see Attribution Analysis Management.
Attribution Analysis Management
Supports saving, saving as, downloading, adding to dashboard, dashboards that reference this chart, deleting charts, viewing update records, and adding sharing.
After modifying the metrics of the attribution analysis again, click "Save" to complete the update.
To create a copy of an attribution analysis, click "Save As", fill in the copy name and description, and save it.
Click [More - Delete Chart], and delete the chart after secondary confirmation.
Click [More - Update Records] to view operation logs for updating this attribution analysis.
Click "Add Sharing" to share this attribution analysis with others. Supports setting visibility to only myself, all members in the project, and specified members. Users granted permissions can view it in attribution analyses under [Shared with Me].
Visible to all members in the project: new members added to the project later will be included by default and assigned the
role. You can search for users to modify permissions separately. Visible to specified members: you can search and add specific users/roles and grant permissions.