Attribute Analysis
Attribute analysis is a proportion analysis based on custom user attributes or preset attributes. It can calculate the attribute proportion of metrics such as user count by different attributes to reach preliminary conclusions. For example, through user count proportion analysis by gender attribute, you can quickly obtain user count statistics for different genders.
Through attribute analysis, you can quickly view user count distribution across different attributes, which helps count total users with different characteristics. When using attribute analysis, you need to choose the measurement method appropriately. Common measurement methods include: user count, distinct count, sum, maximum, minimum, and average.
For example: if the selected metric is "average of cumulative consumption amount", the dimension is "membership level", and the user selects "all users", the result shows the average consumption amount of users at each membership level.
Create Attribute Analysis
Go to Behavior Analysis - Attribute Analysis, and click Create Attribute Analysis.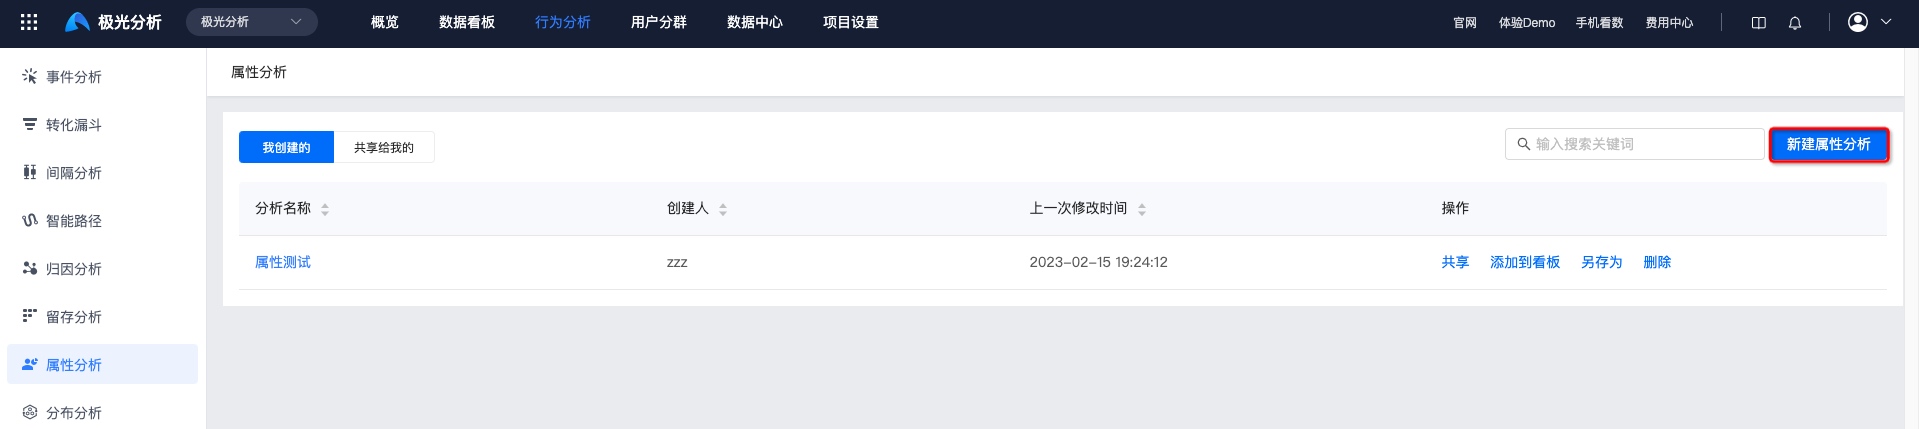
Set Metrics
Click Please select to add user attributes to analyze. Multiple attributes are supported.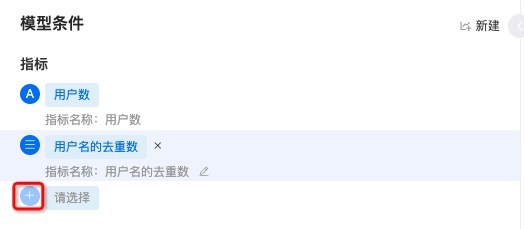
Select Breakdown Dimensions
Attribute analysis supports multi-dimensional comparison.
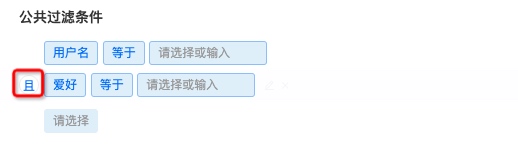
Set Global Filter Conditions
You can add global filter conditions for attributes to constrain multiple metrics. Conditions follow the structure attribute - operator - attribute value.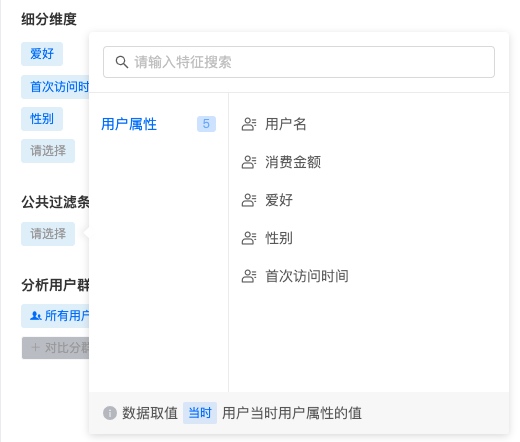
- Multiple filter conditions are supported. The default relationship is intersection. Click And to switch between intersection and union.
Select Comparison Segments
JAnalysis supports viewing metrics under a specific segment, and also supports comparison across multiple segments.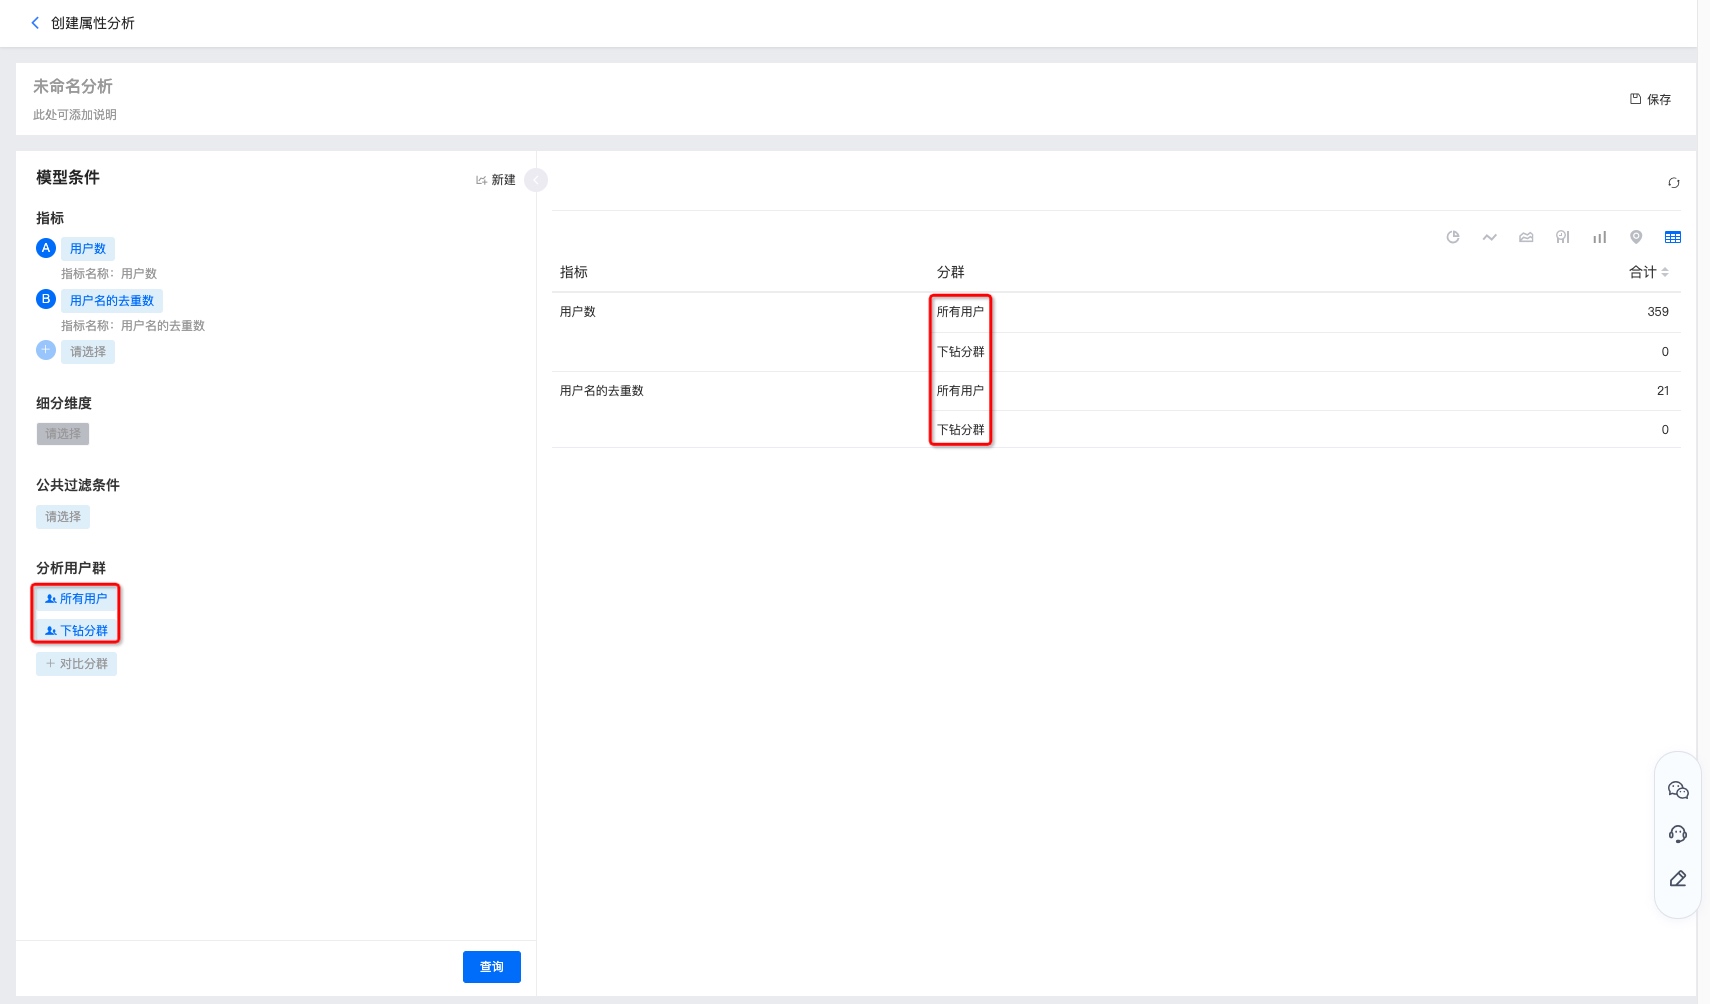
Configure Chart Display
After setting event metrics, click Query to view the chart.
Force Refresh
The last refresh time is shown in the upper right corner. Click it to force refresh if you need current data.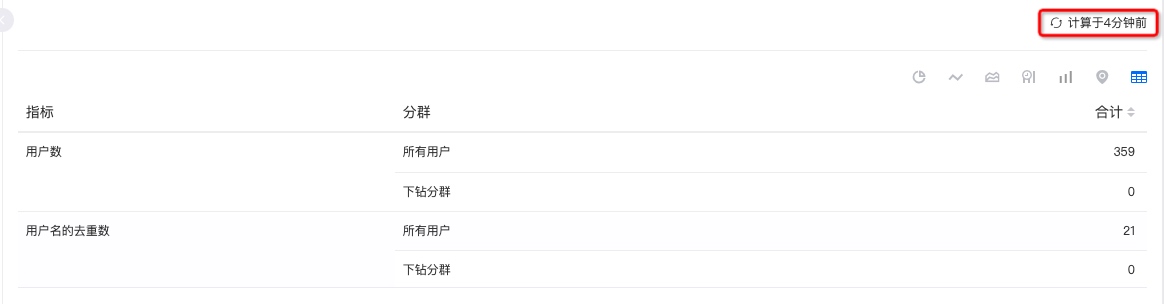
Chart Styles
Query results for different combinations of metrics, conditions, audiences, and dimensions can be displayed as pie charts, line charts, area charts, time bar charts, bar charts, maps, data tables, and more.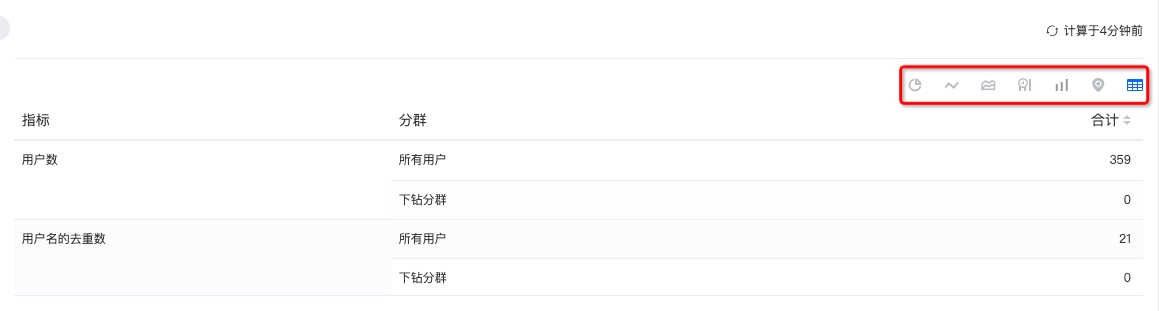
Save Analysis
Click Save in the upper right corner and fill in the name to create the attribute analysis.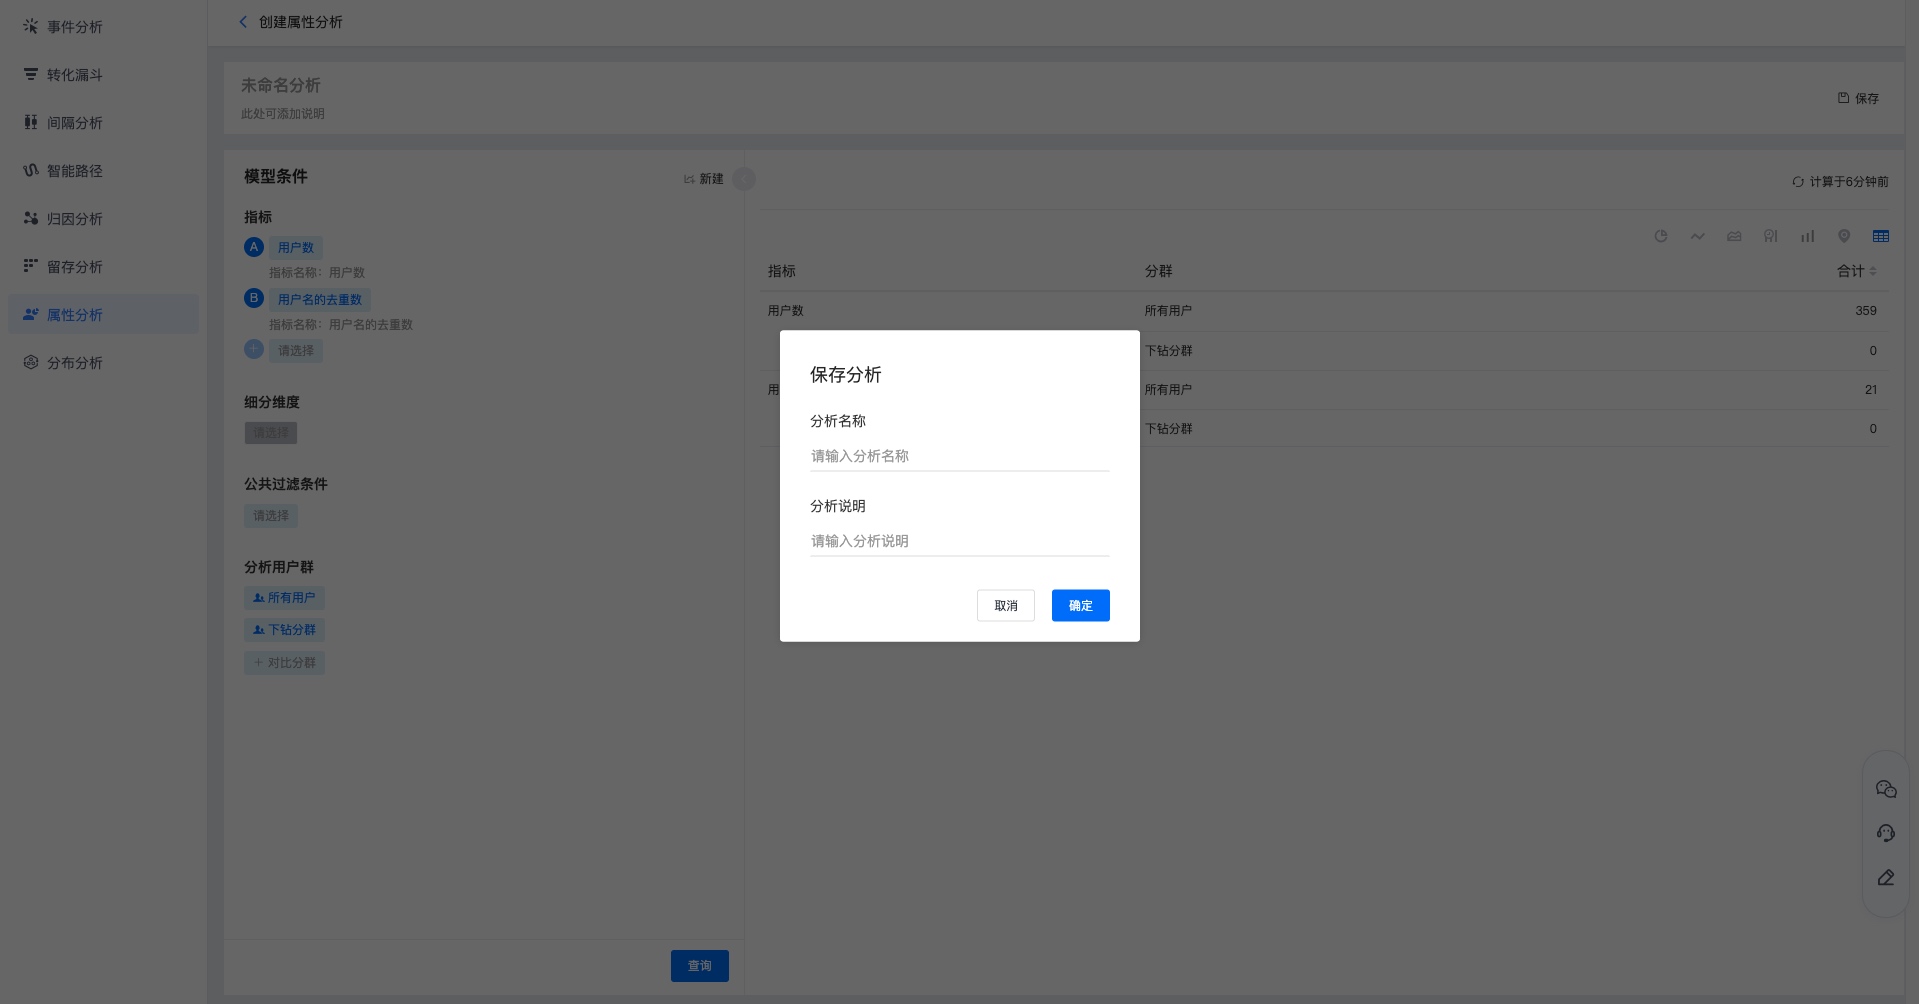
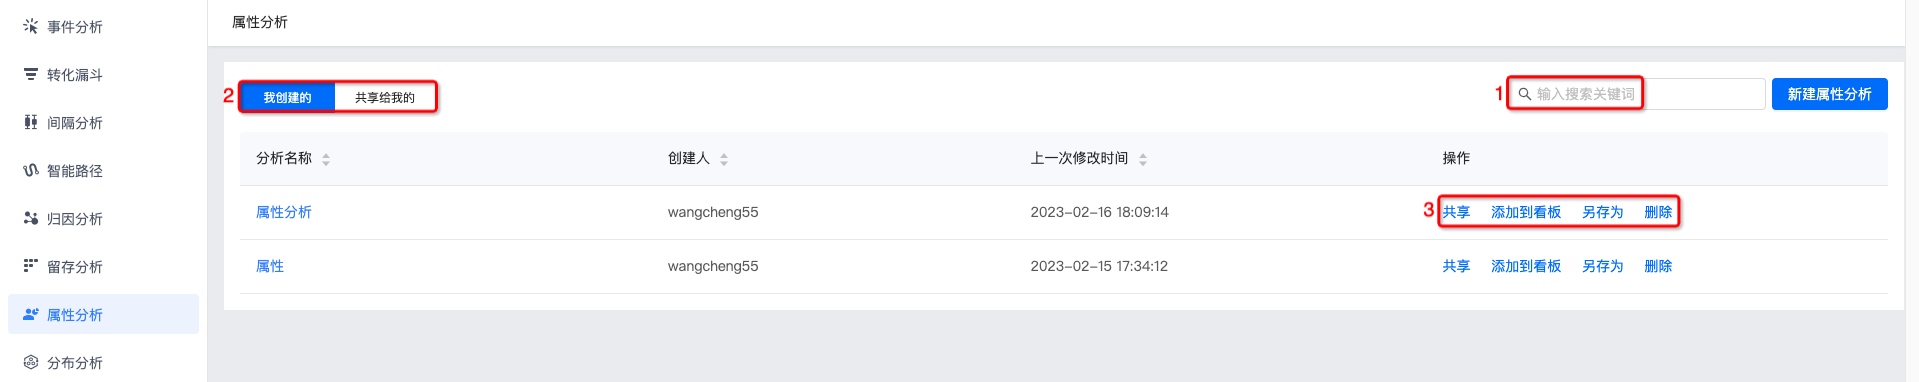
View Attribute Analysis
Search by attribute analysis name in the search box.
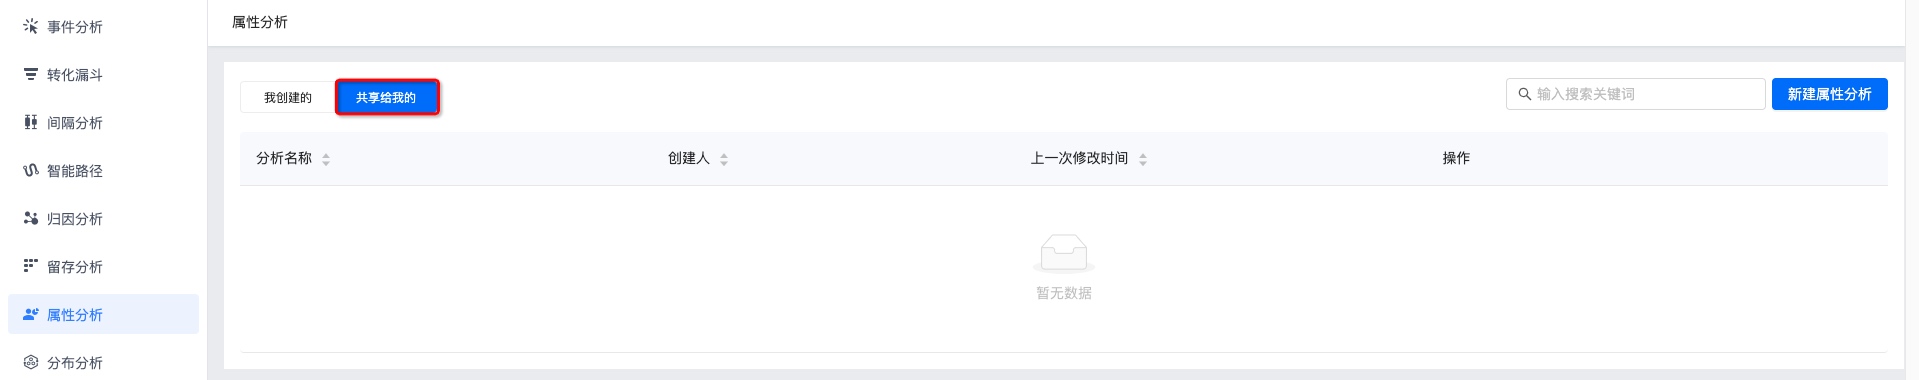
View attribute analyses under Created by me and Shared with me. Click the name to view results.
Share, add to dashboard, save as copy, and delete. See Attribute Analysis Management for details.
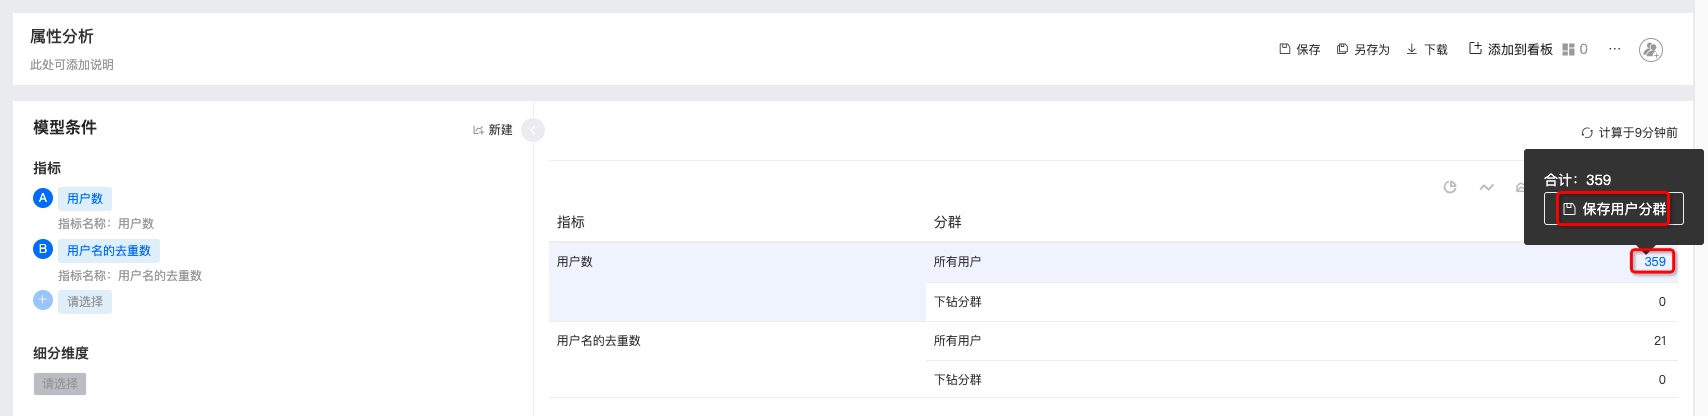
Click the user count in the table to save a user segment.
Attribute Analysis Management
Supports save, save as copy, download, add to dashboard, view dashboards referencing the chart, delete chart, view update history, and add sharing.
After modifying attribute analysis metrics, click Save to update.
To create a copy, click Save as, fill in the copy name and description, and save.
To download data, click Download. Content includes configured metrics and detailed data.
Click Add to dashboard to save under My Dashboard - My Groups.
Click Dashboards referencing this chart to see which dashboards use this analysis.
Click More - Delete chart and confirm to delete.
Click More - Update history to view operation logs.
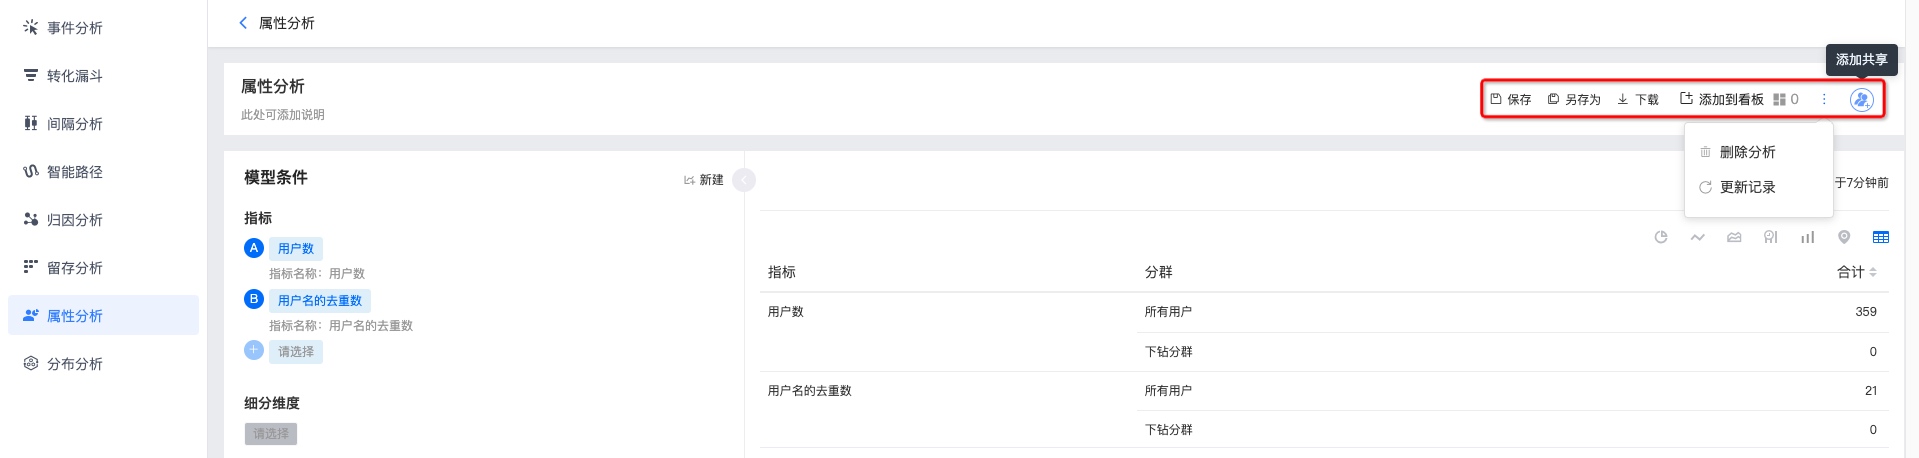
Click Add sharing to share with others. Options: visible only to me, visible to all project members, or visible to specified members. Authorized users can view under Shared with me.
Visible to all project members: newly added project members are included by default with View only role. You can search users to change permissions individually.
Visible to specified members: search and add users/roles to grant permissions.