Retention Analysis
Retention analysis is a model for analyzing user engagement and activity by configuring an initial behavior and a subsequent behavior. It is commonly used after product upgrades or operational campaigns when operations staff need to monitor retention rates for the affected user groups.
Use cases
- A product launched a check-in campaign offering coupons; analyze how many users entered the campaign page and completed 7 consecutive days of check-ins.
- An app added a "tipping" feature; observe whether creators have started using the app more frequently because of it.
Create a retention analysis
Go to Analytics Center → Retention Analysis and click "New".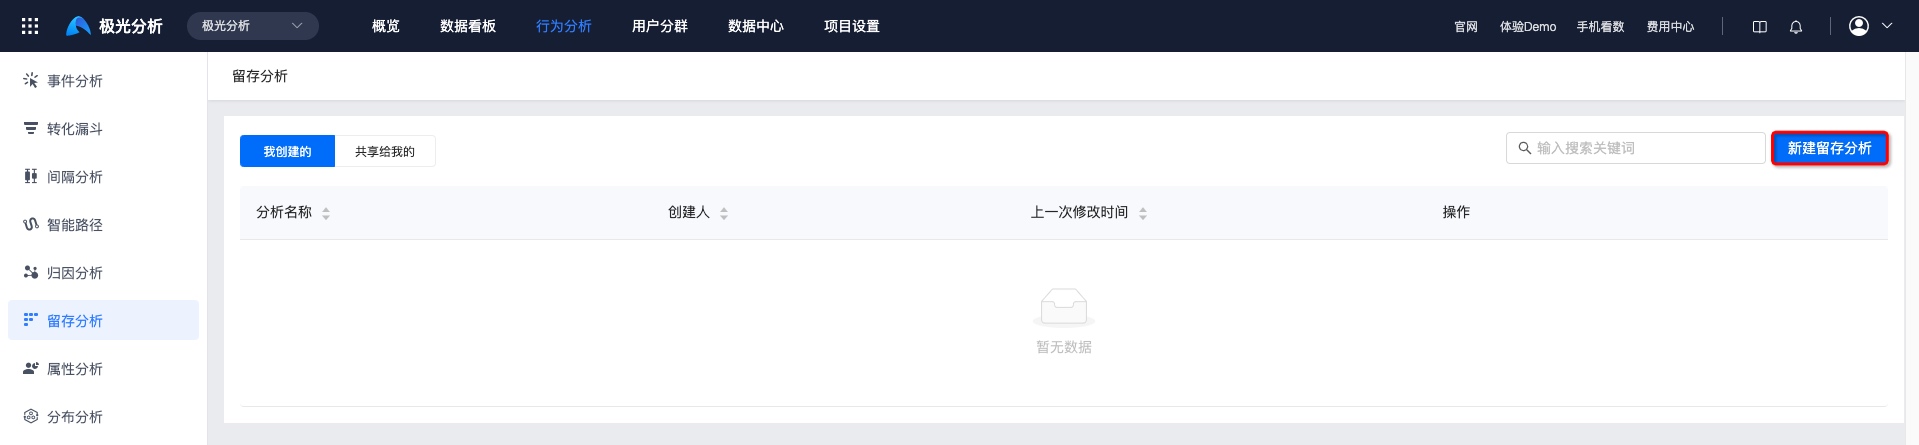
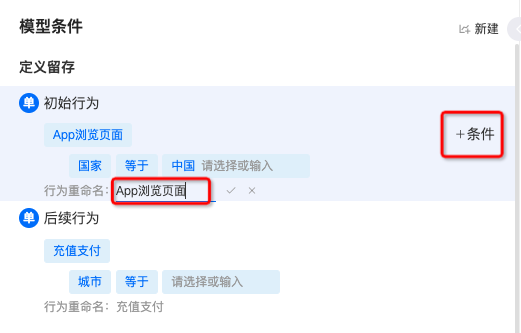
Set initial behavior / subsequent behavior
To analyze retention behavior of users from China who browsed products and later purchased, set the initial behavior to "View page" with filter "Country = China", and the subsequent event to "Top-up / Payment".
- Meta-events with data reported, virtual events, and all composite events appear in the lists for initial event and subsequent event.
- Click "+ Condition" to add filter conditions.
- Behaviors can be renamed.
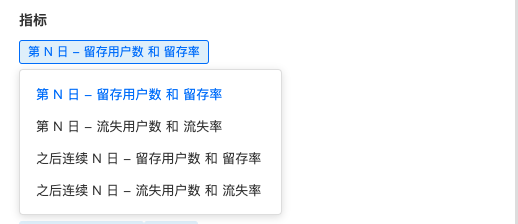
Set metrics
Retained users: users who performed the initial behavior on a given day/week/month and performed the subsequent behavior on the Nth day/week/month.
Retention rate: the share of retained users on the Nth day/week/month among the users who performed the initial behavior.
Churned users: users who performed the initial behavior on a given day/week/month but did not perform the subsequent behavior on the Nth day/week/month.
Churn rate: the share of churned users on the Nth day/week/month among the users who performed the initial behavior.
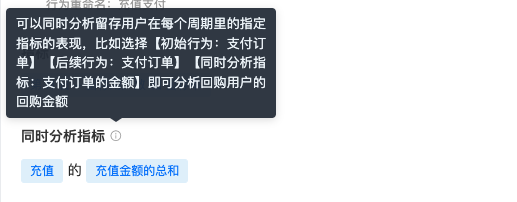
Set concurrent metrics
You can also analyze retained users' specific metrics in each period. For example: pick Initial behavior: Pay order, Subsequent behavior: Pay order, Concurrent metric: Pay order amount to analyze repeat purchase amount of repurchase users.
When viewing by subdivided dimension, concurrent metrics cannot be displayed at the same time.
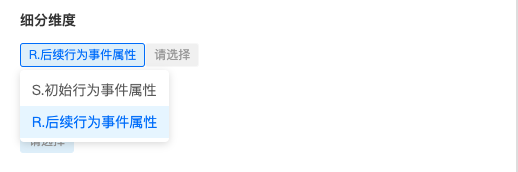
Choose subdivided dimensions
You can view retention by different attribute values within a dimension, e.g. new-user retention by city, to identify factors affecting retention. Different attribute-value types support different grouping methods.
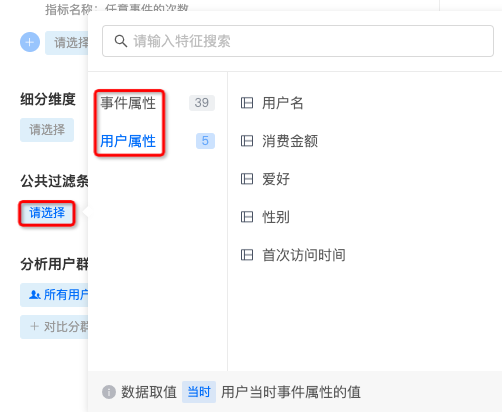
Set global filters
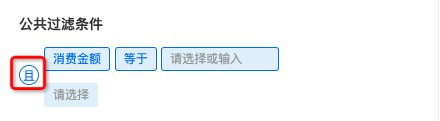
You can add per-event filters; you can also add global filters that constrain multiple metrics. A condition has the structure attribute - operator - value; attributes are either event attributes or user attributes.
Multiple filters are supported; by default they are joined with AND. Click "AND" to toggle between AND and OR.
Choose comparison segments
JAnalysis supports viewing metrics under a single segment, and comparing across multiple segments.
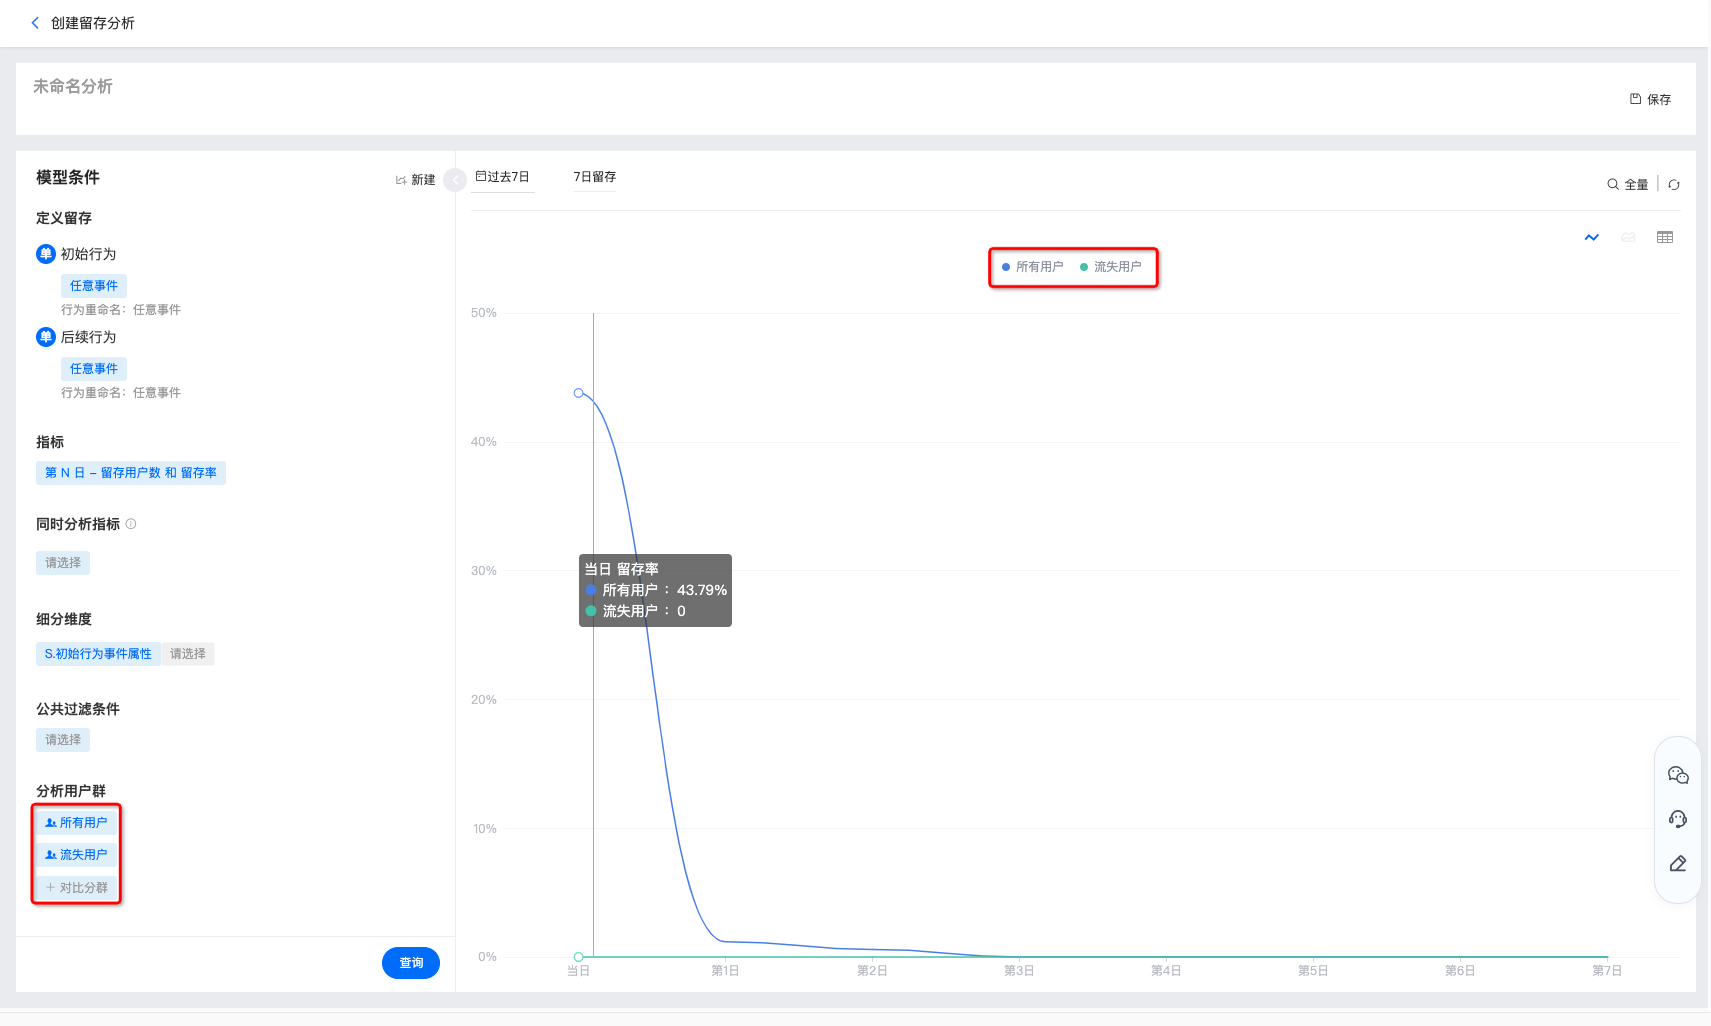
Configure chart display
After configuring metrics, click "Query" to view the chart.
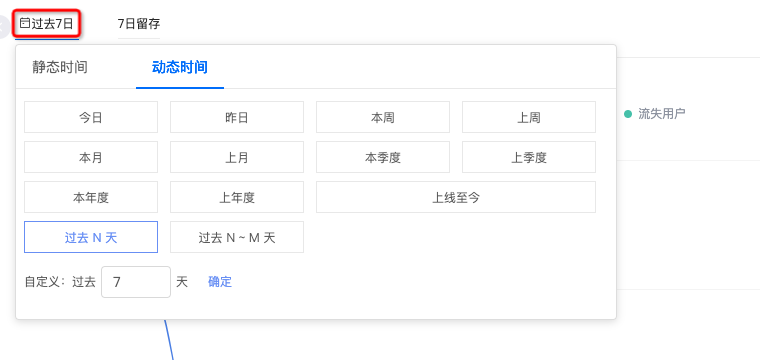
Choose a time range
Pick a common range such as Last 30 days, Today, Last week, or set a custom start and end date on the right.
When you select a relative time range and save the chart, future queries show a dynamic time range. For example: if today is March 16 and you choose "Last 7 days", the query returns data for March 9 through March 15; when you open the saved chart on March 21, you see data from March 14 through March 20.
The time range applies to the date when the initial behavior occurred. Example: with 2018/03/01 – 2018/03/07 and initial behavior = register, subsequent behavior = any event, the chart computes the retained users among those who registered each day in that week, returning within the next 30 days.
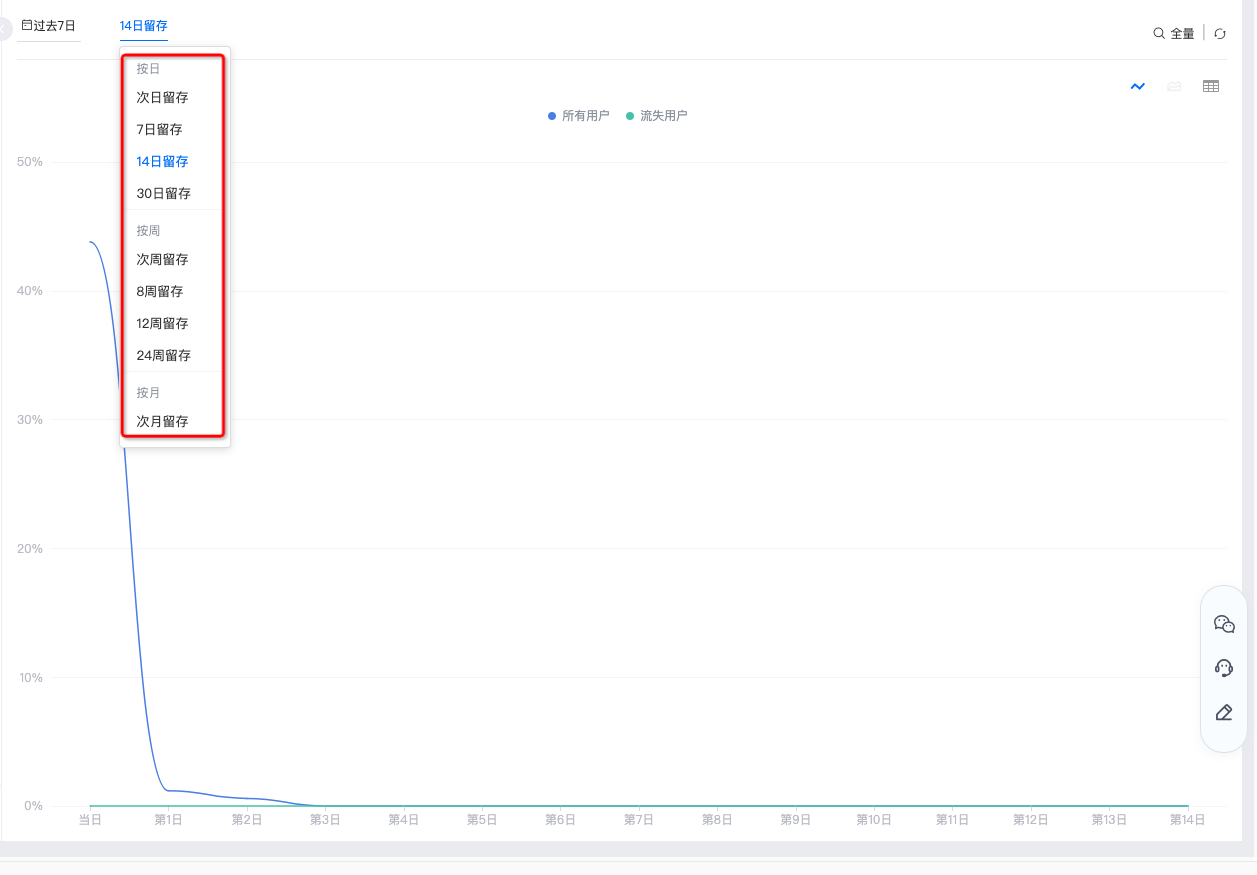
Set time granularity
Available granularities:
- By day: view next-day, 7-day, 14-day, and 30-day retention.
- By week: view next-week, 8-week, 12-week, and 24-week retention.
- By month: view next-month, 6-month, 12-month, and 24-month retention.
Set sampling ratio
You can configure the sampling ratio: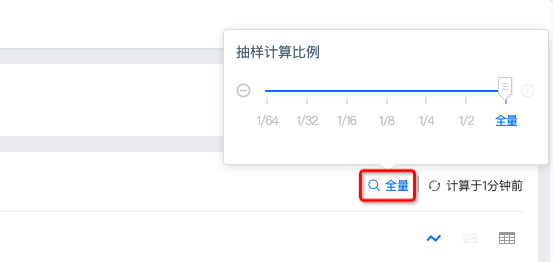
Force refresh
The last refresh time is shown in the upper right; click to force-refresh to see current data.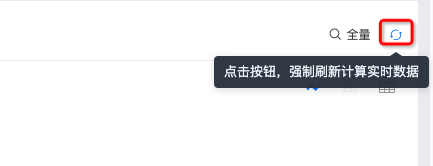
Chart styles
Different combinations of metrics, conditions, segments, and dimensions are displayed as line charts, area charts, or data tables.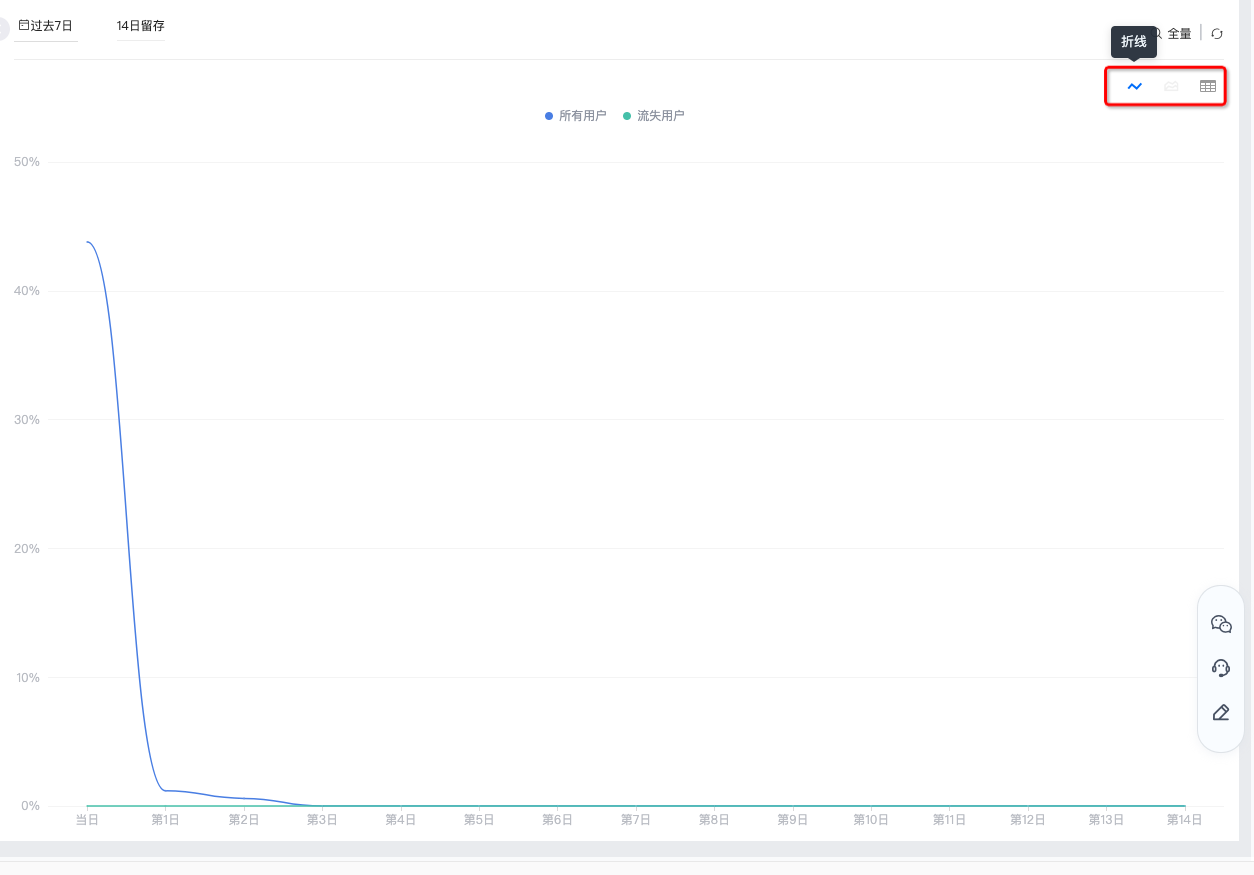
Save the analysis
Click "Save" in the upper right and fill in a name to create the retention analysis.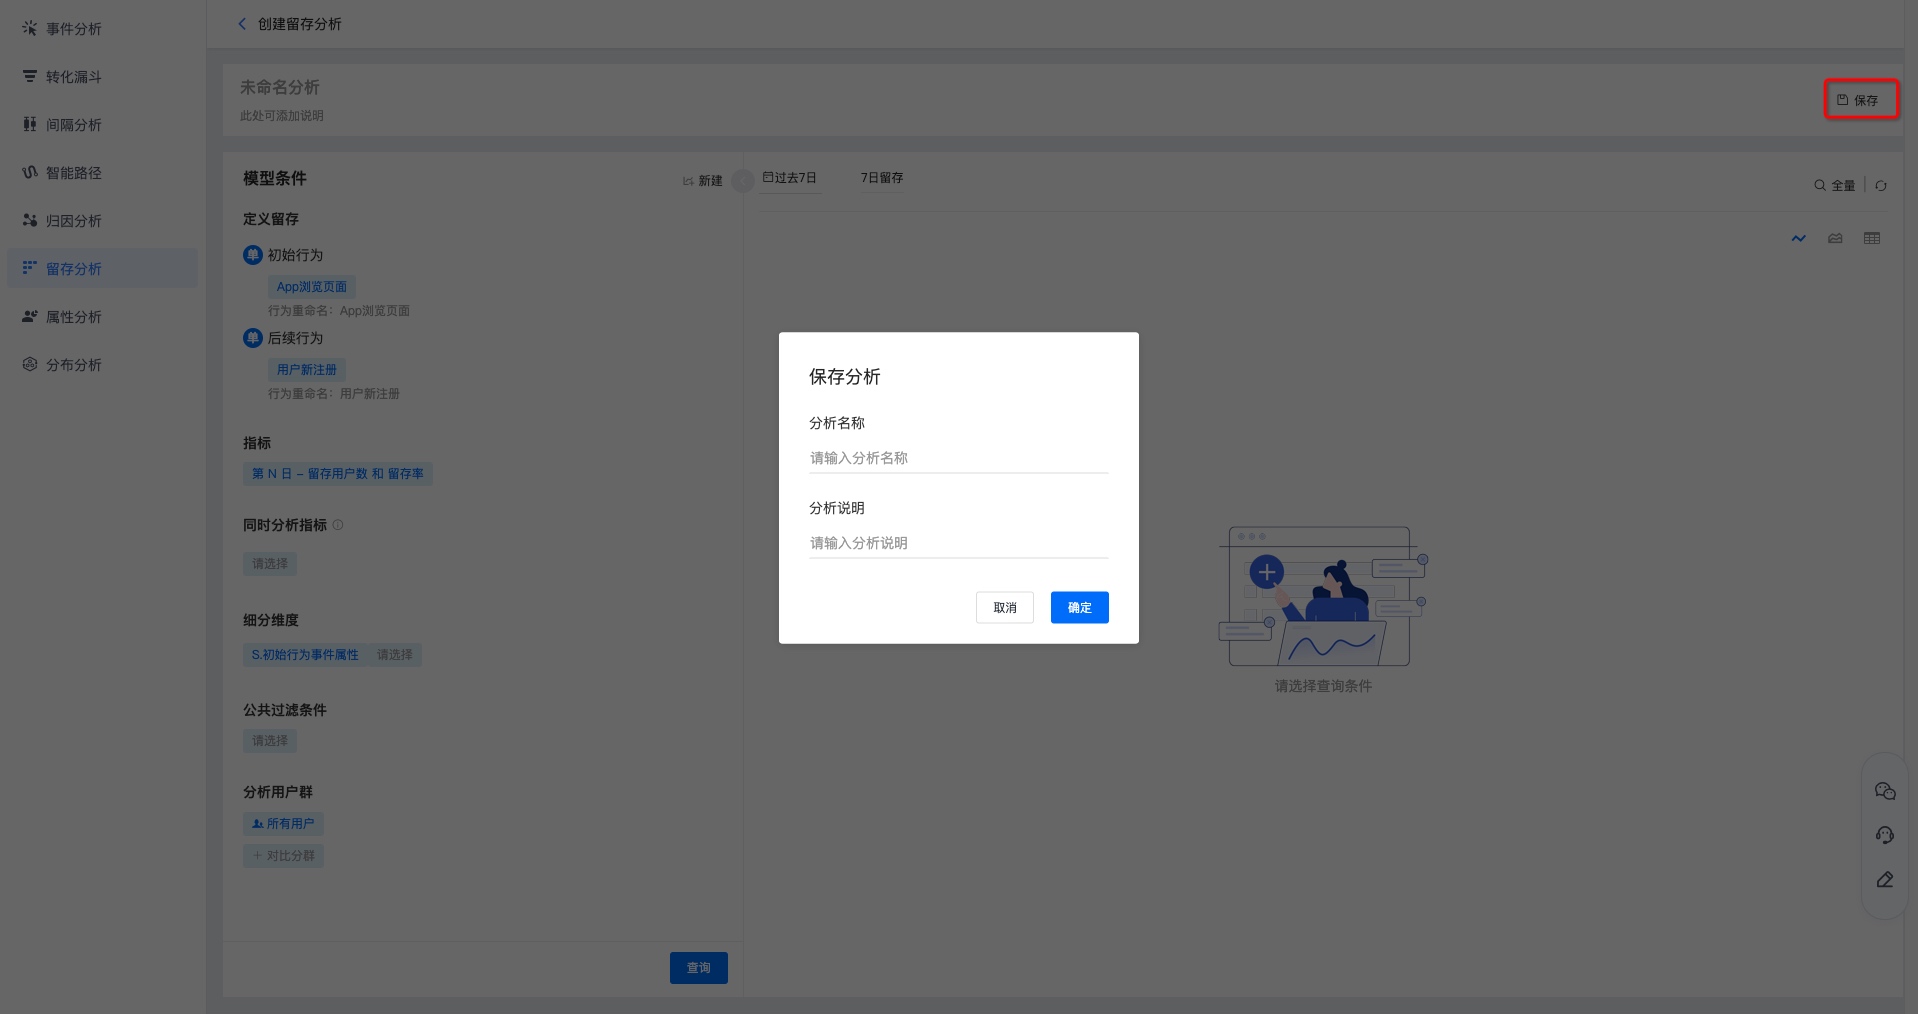
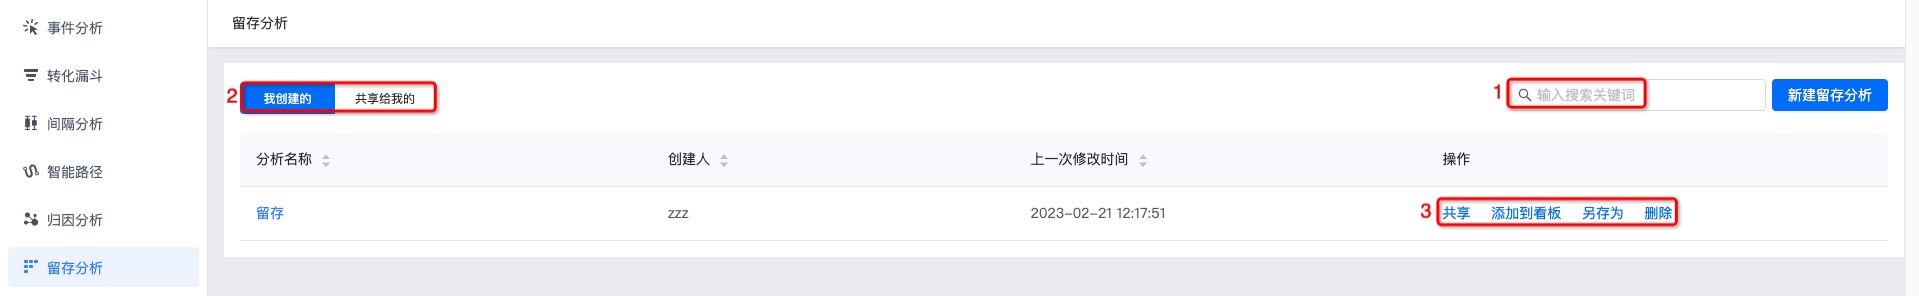
View retention analyses
The search box supports searching by retention-analysis name.
View "Created by me" and "Shared with me" retention analyses; click a name to see the results.
Sharing, adding to dashboard, save-as, and delete operations are supported; see Manage retention analyses.
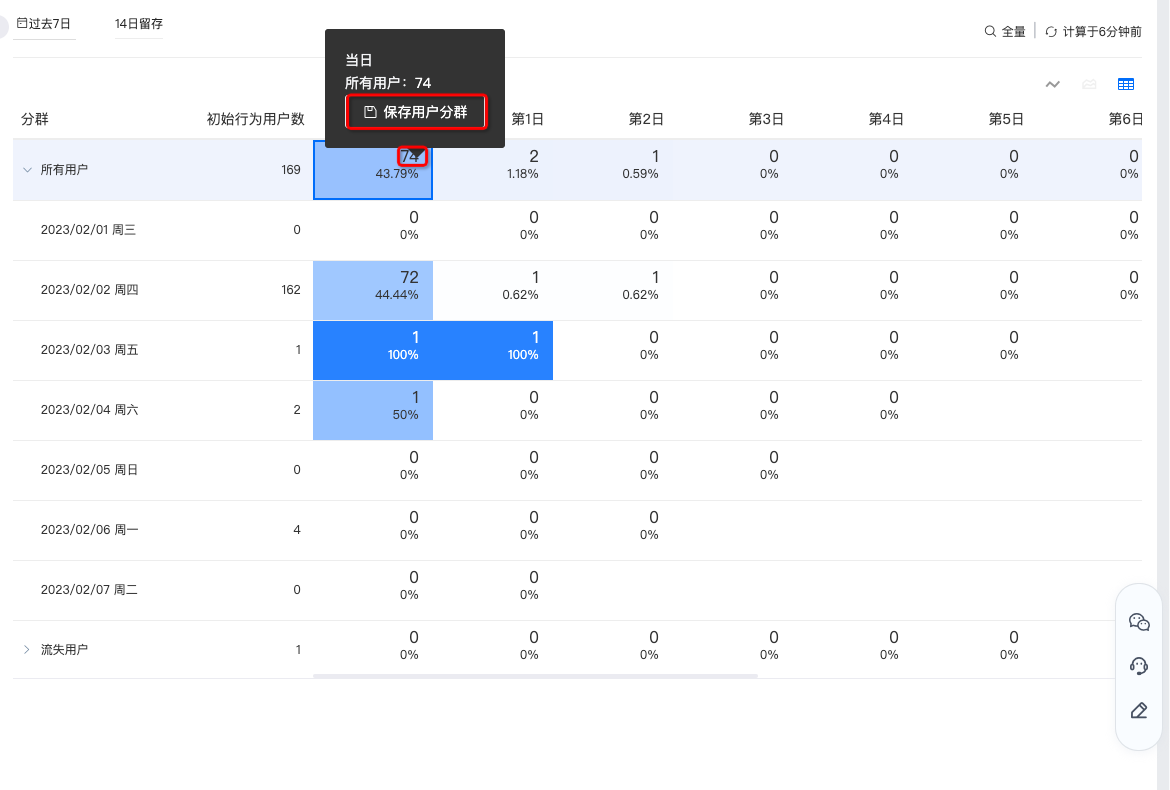
Click a number in the table to save the corresponding users as a segment.
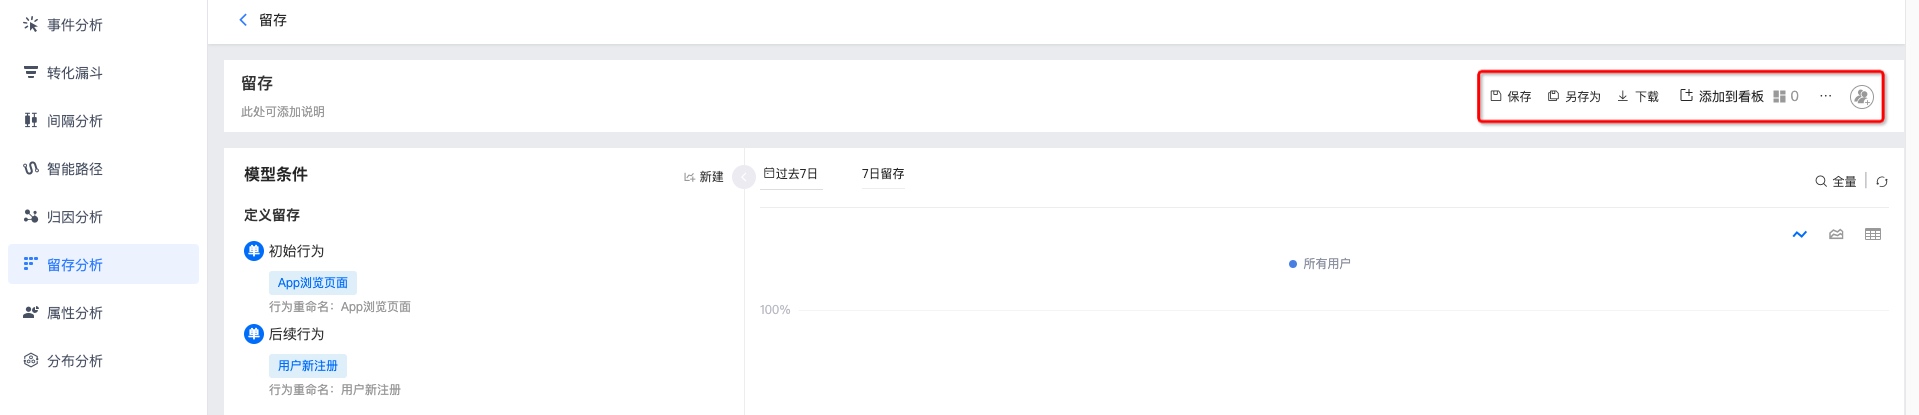
Manage retention analyses
Supports save, save-as, download, add to dashboard, view dashboards that reference this chart, delete chart, view change history, and share.
After editing the metrics, click "Save" to update.
To create a copy, click "Save as", fill in a copy name and description, and save.
To download the data, click "Download"; the download includes the configured metrics and detailed data.
"Add to dashboard" saves the chart under "My Dashboards → My Group".
"Dashboards that reference this chart" lists the dashboards using this retention analysis.
"More → Delete Chart" deletes the chart after confirmation.
"More → Change History" shows the operation log of changes to this retention analysis.
Click "Share" to share the retention analysis with others. You can choose: visible only to me, visible to all members of the project, or visible to specified members. Authorized users can find it under "Shared with me".
Visible to all members: members added later are joined by default with the "View only" role; you can search a user and modify their permission individually.
Visible to specified members: search and add specific users/roles with permissions.