My Dashboard
Overview
To make it easy to quickly view important product metrics, you can add dashboards and charts to data dashboards and customize the product analyses that need quick access.
- My Dashboard: dashboards created by me. Custom groups and dashboards can be added.
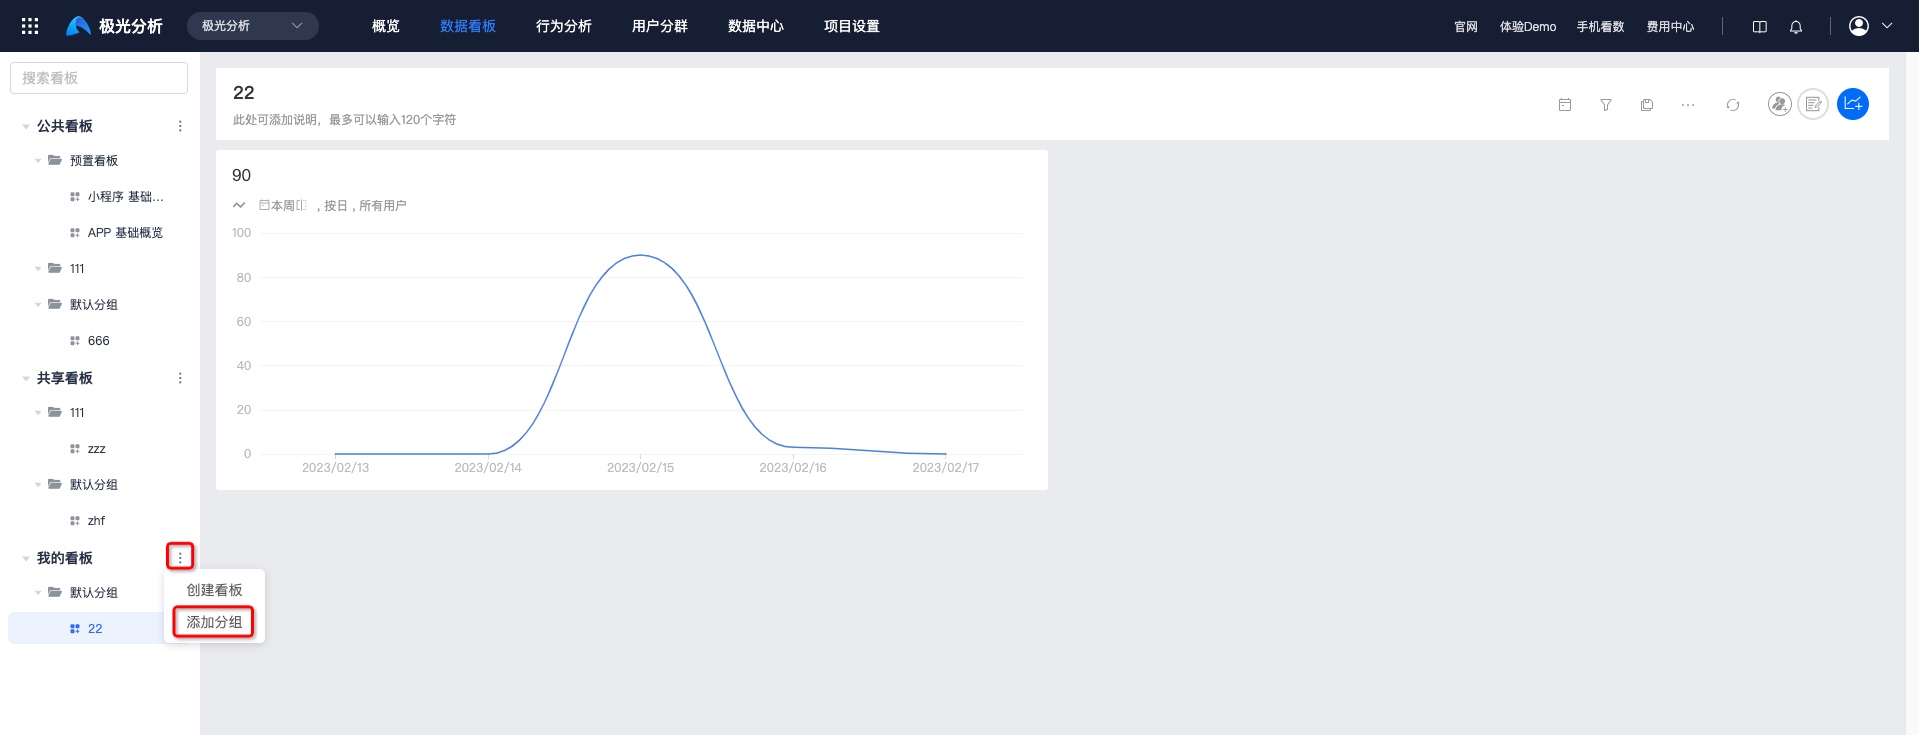
Group Management
Click [Public/My Dashboard - More - Add Group], and fill in the group name to add a group.
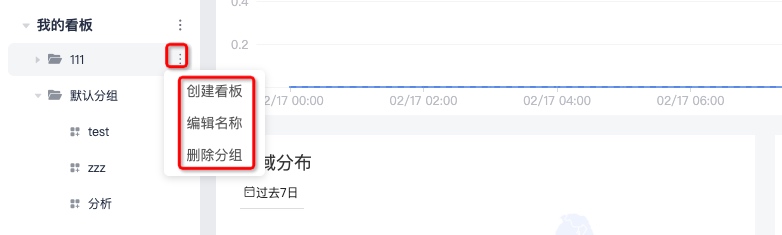
Click [Group Name - More - Edit Name] to modify the group name.
Click [Group Name - More - Delete Group], and delete the group after secondary confirmation.
Create a Dashboard
Click [Public Dashboard/My Dashboard - More - Create Dashboard], and fill in the dashboard name to create it successfully.
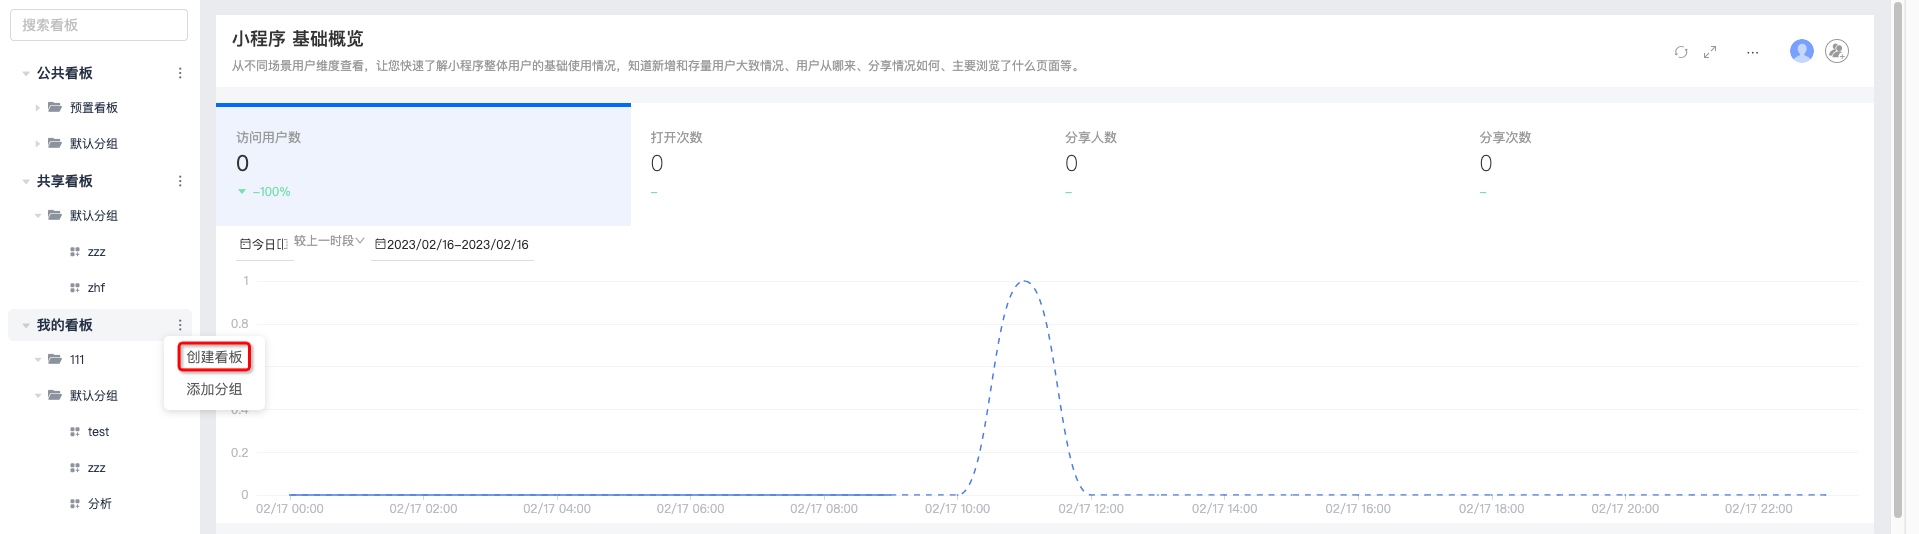
A newly created dashboard is saved to the default group by default.
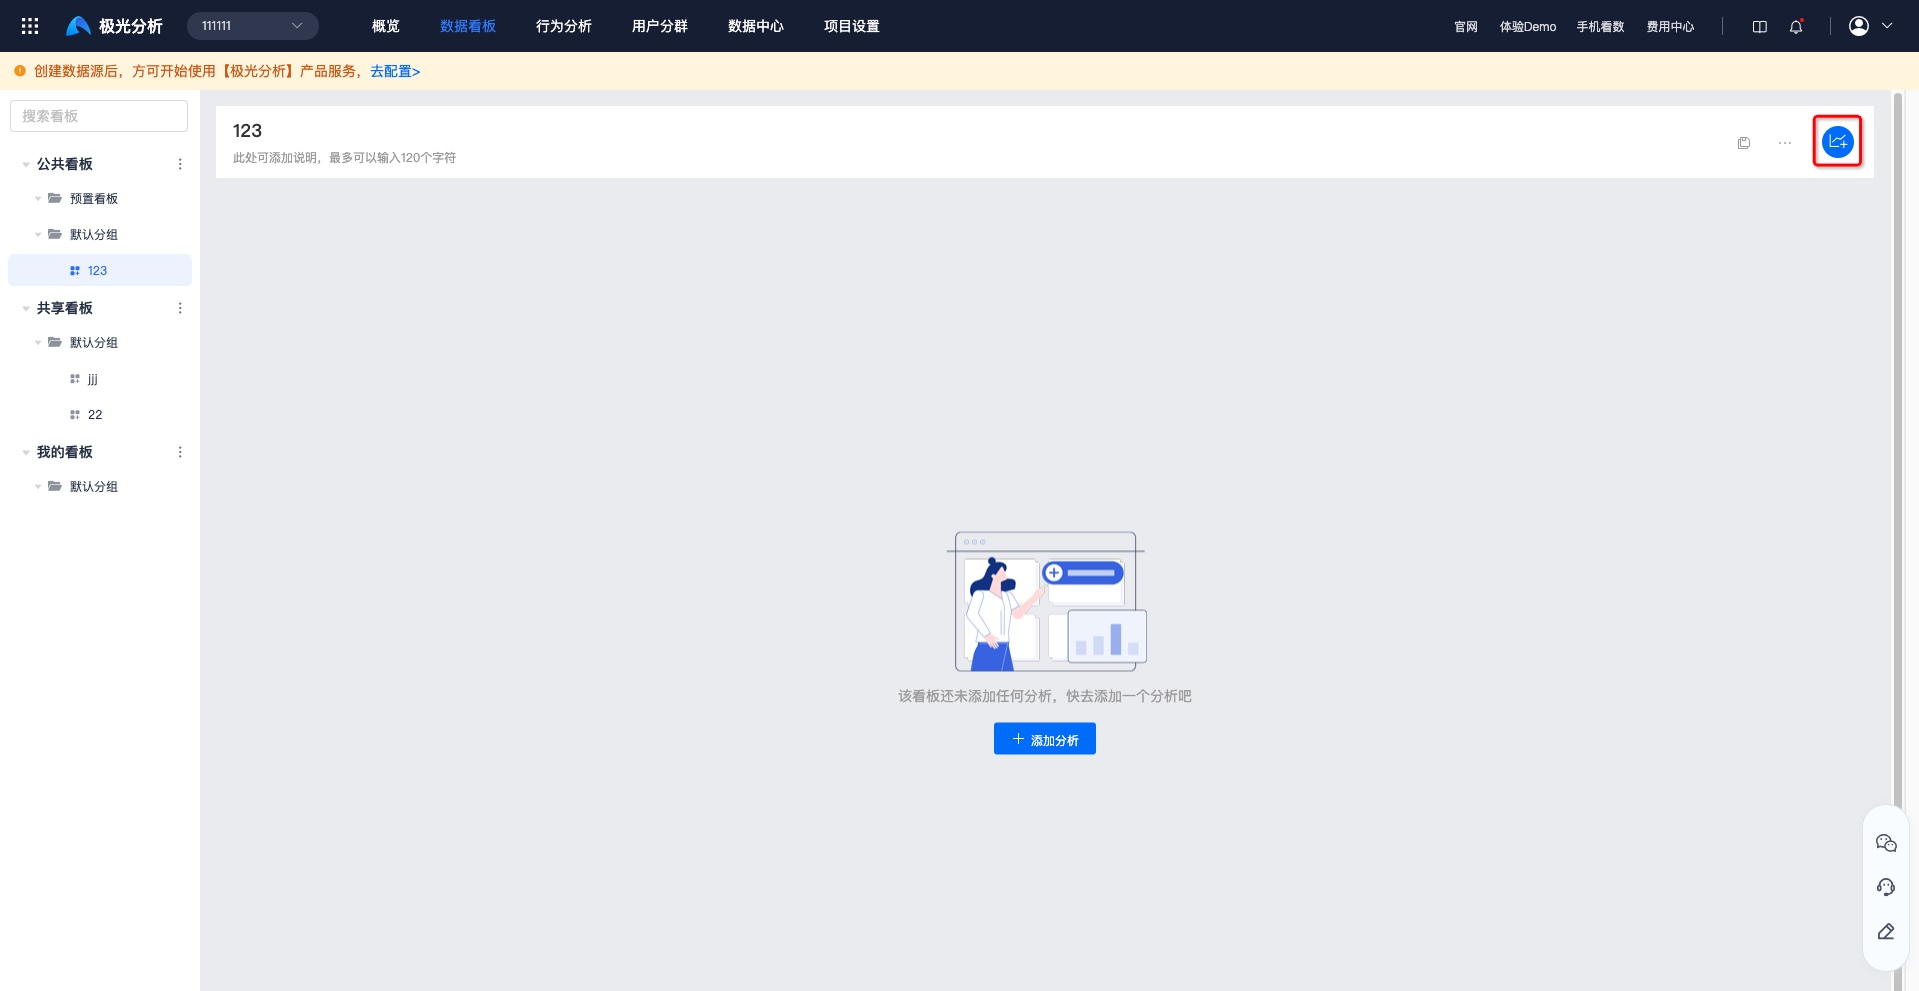
Add Charts
Click "Add Chart" to add saved charts and saved segments.
At position 1, you can select saved charts/segments to add. Charts need to be created in [Behavior Analysis], and segments need to be created in [User Segmentation].
Chart filtering and search are supported. Filter options are: All Lists, System Preset, Created by Me, and Shared with Me.
Select the charts to display at position 3, and click "Confirm Add".
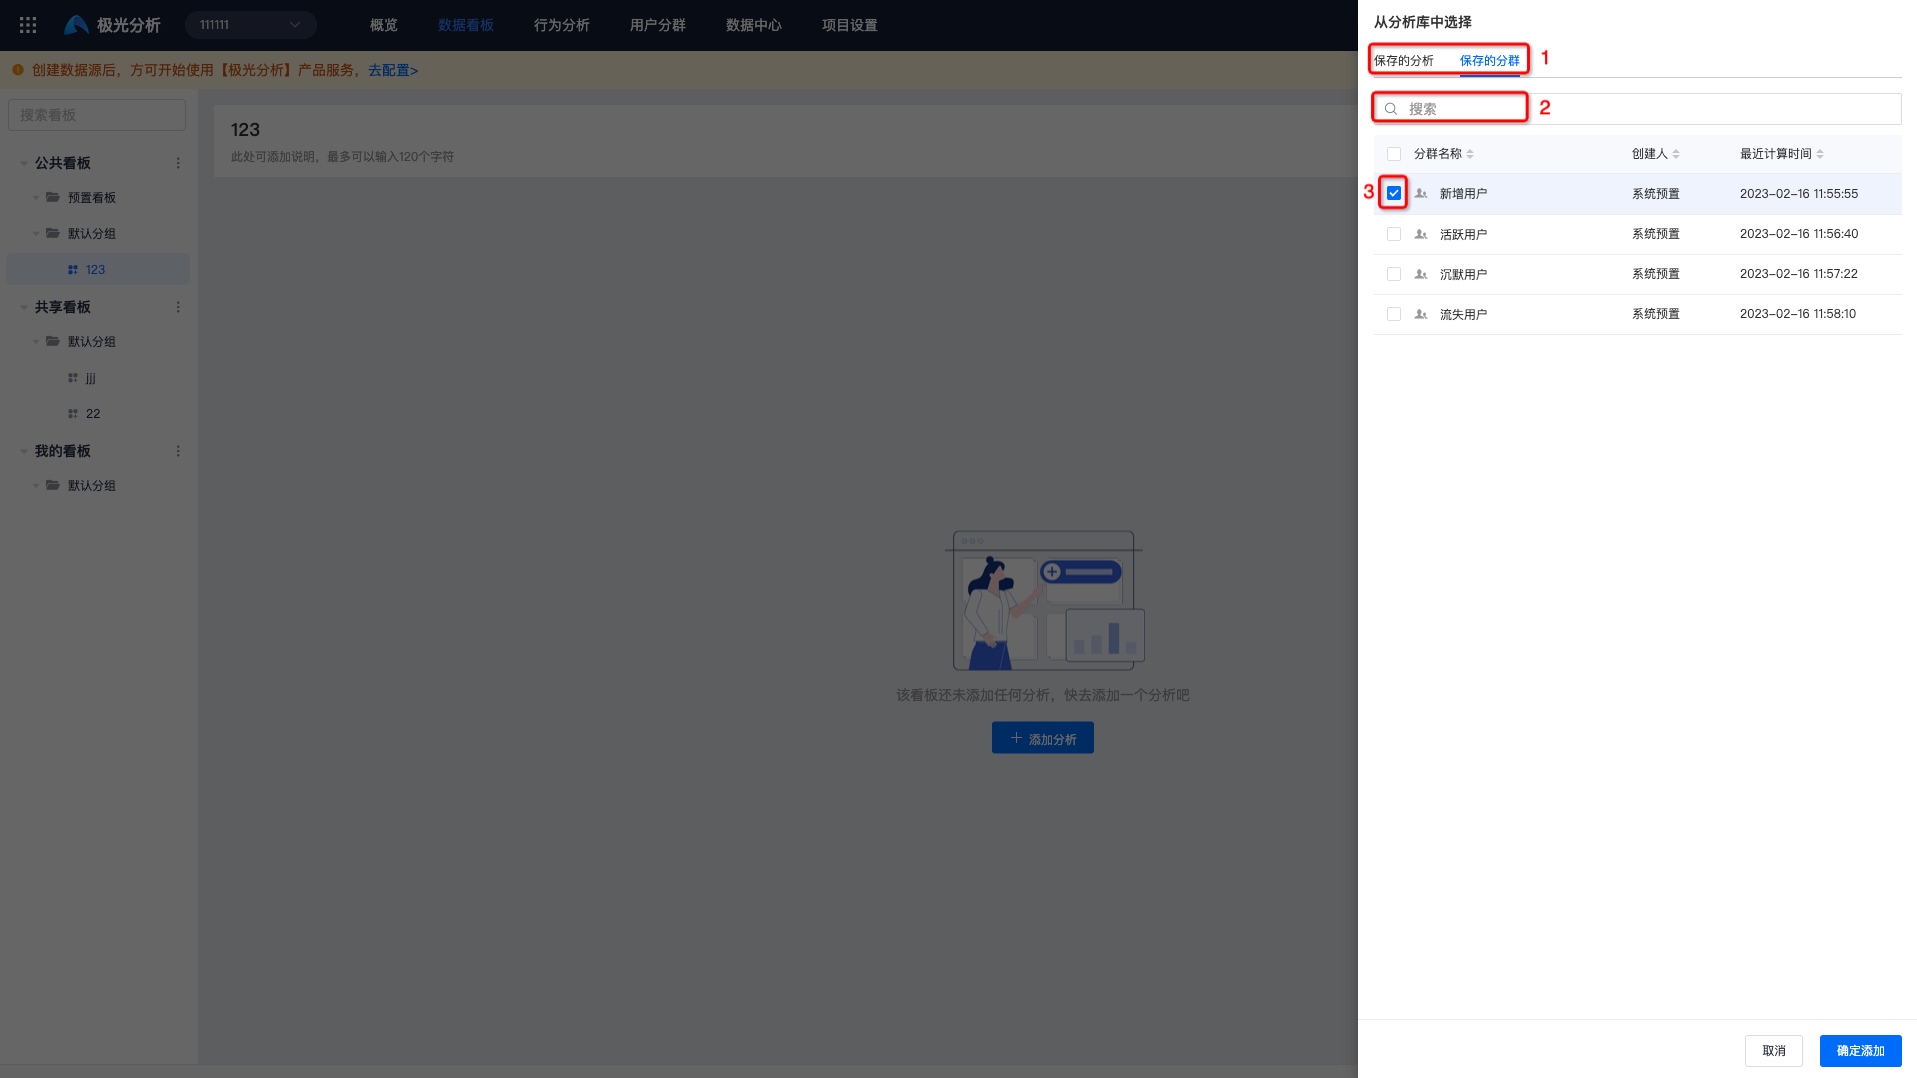
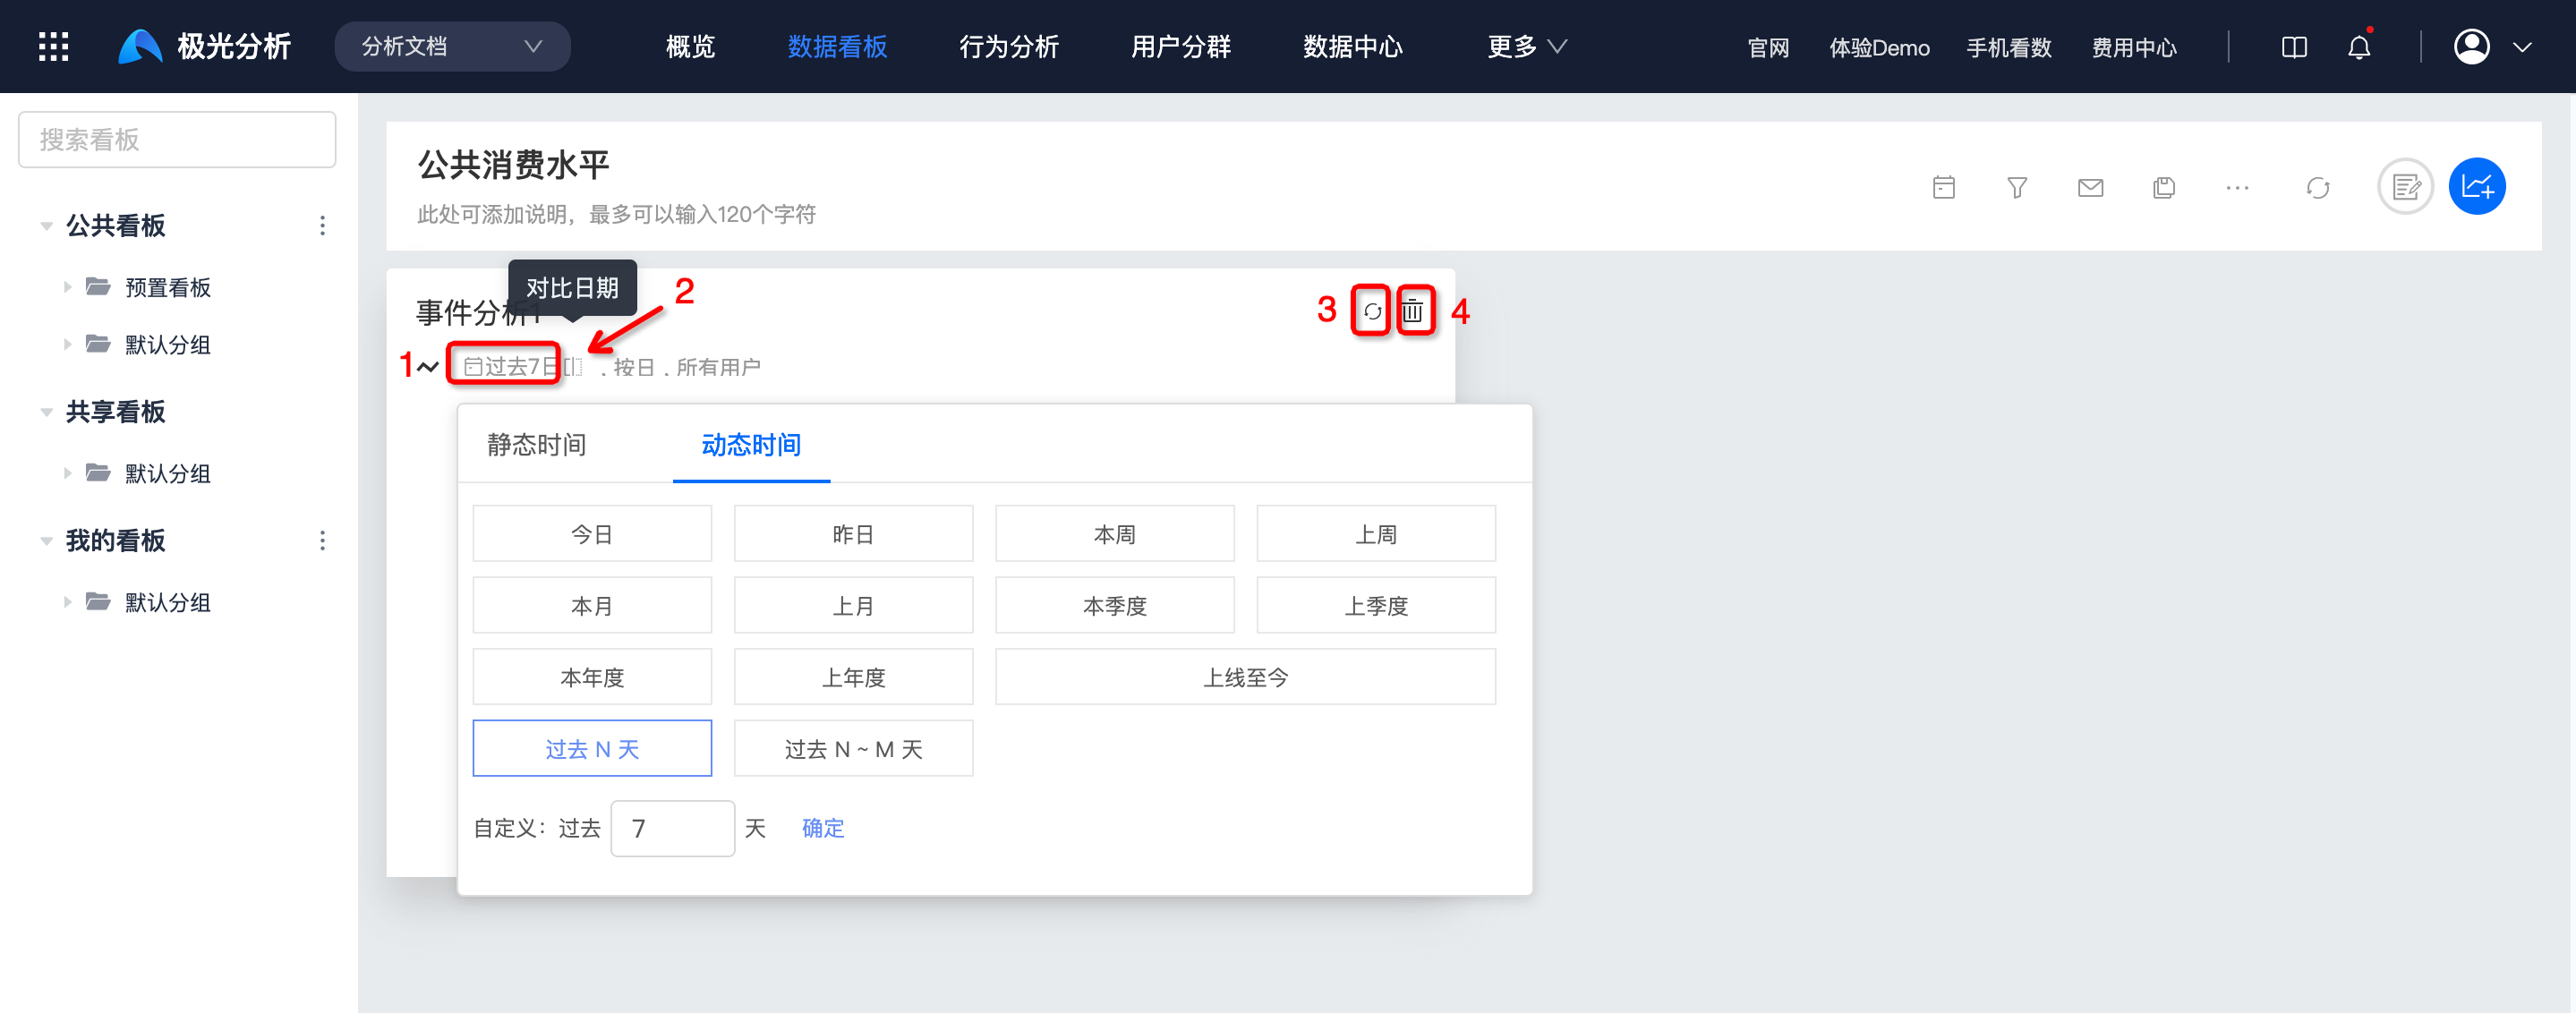
Chart Management
Click the time at position 1 to select the display date. Static time and dynamic time are supported.
Click position 2 to select dates for data comparison. Supported options are: previous period, same period last year, and custom.
Click position 3 to force refresh and calculate real-time data.
Click position 4 and delete the chart after secondary confirmation.
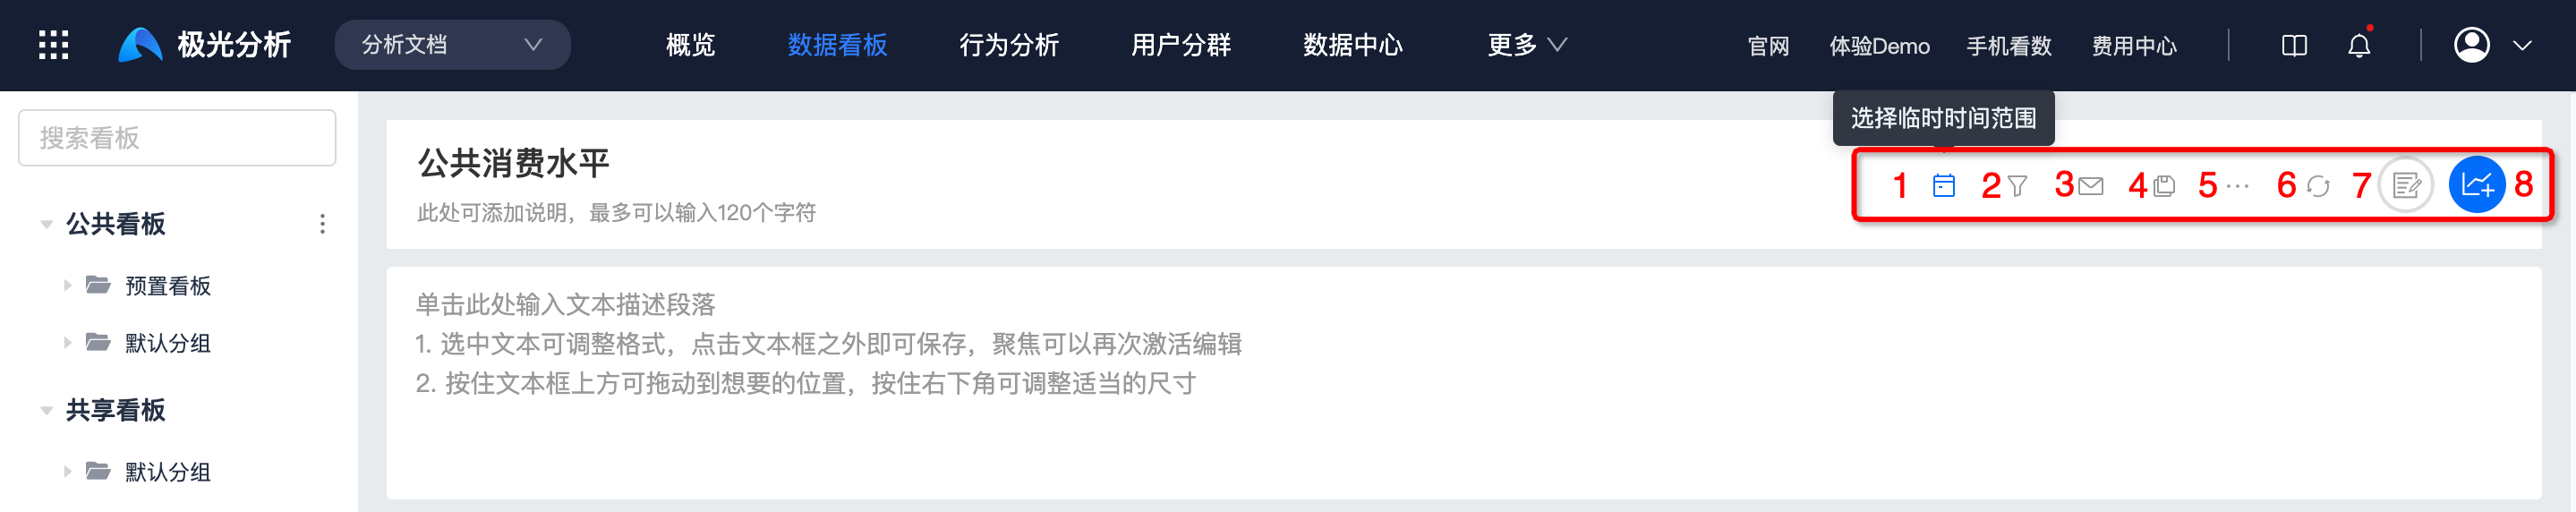
Dashboard Management
Dashboards support search, selecting a temporary time range, setting common filter conditions, creating email subscriptions, saving as, More, forced data refresh, adding text, and adding charts.
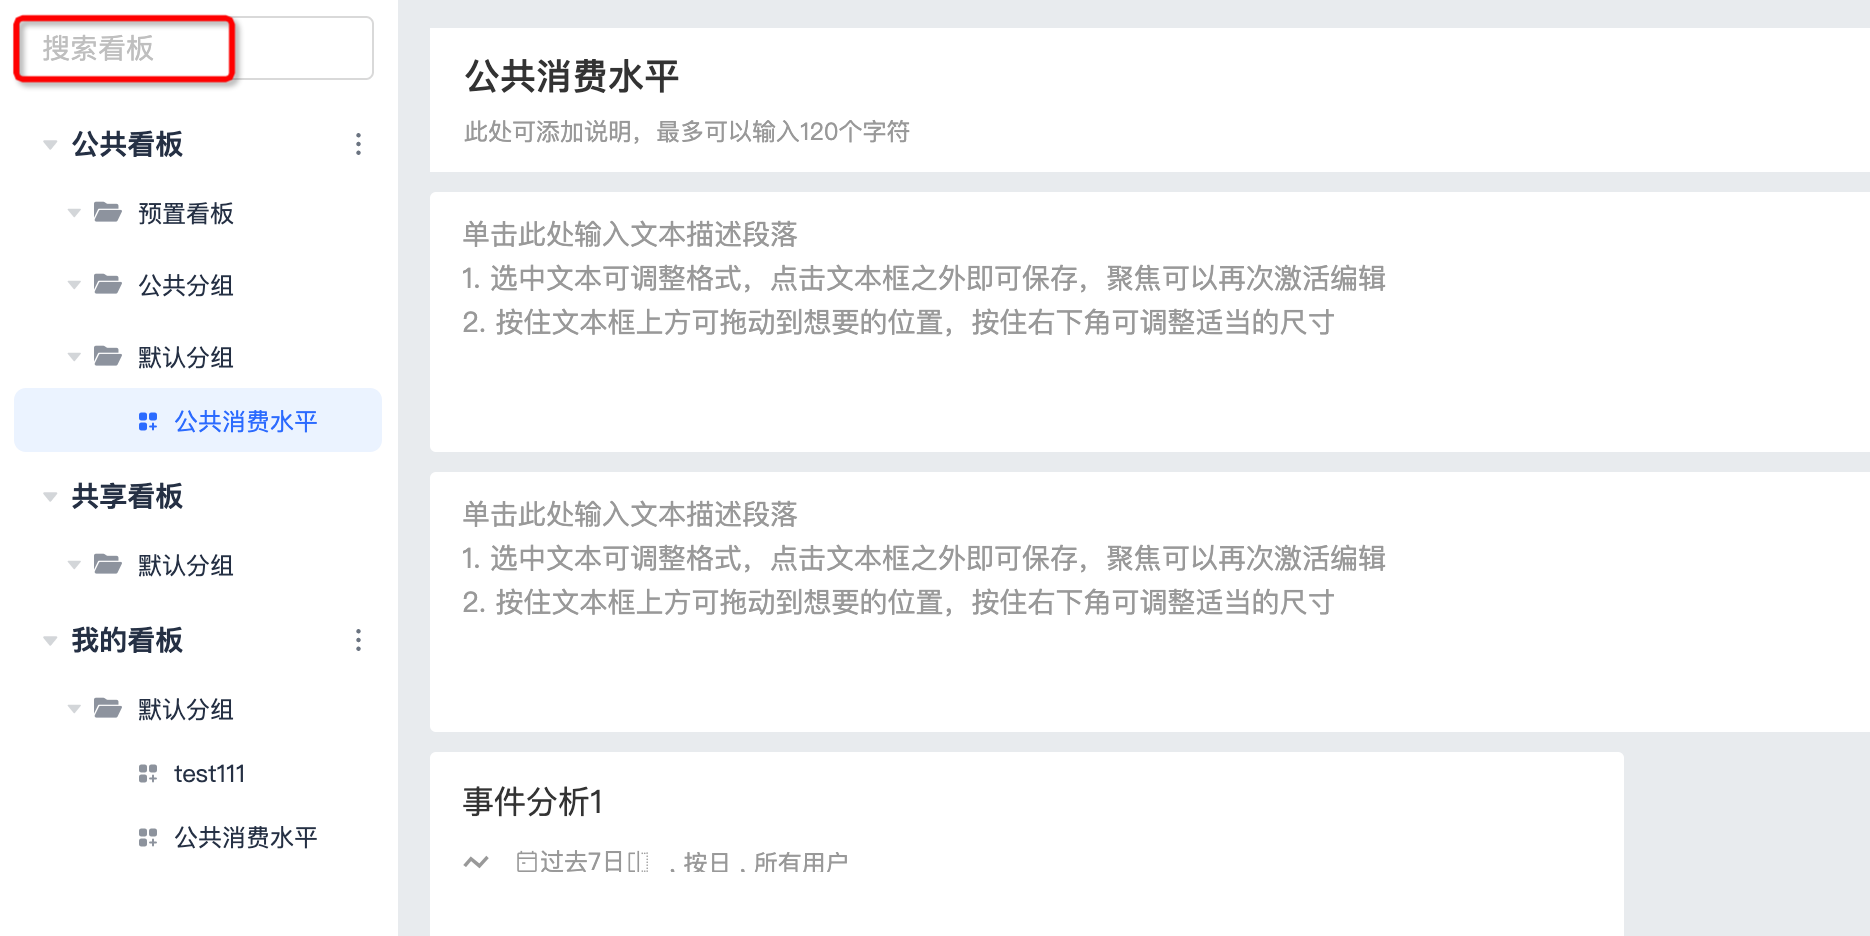
Search
Searching dashboards by name is supported.
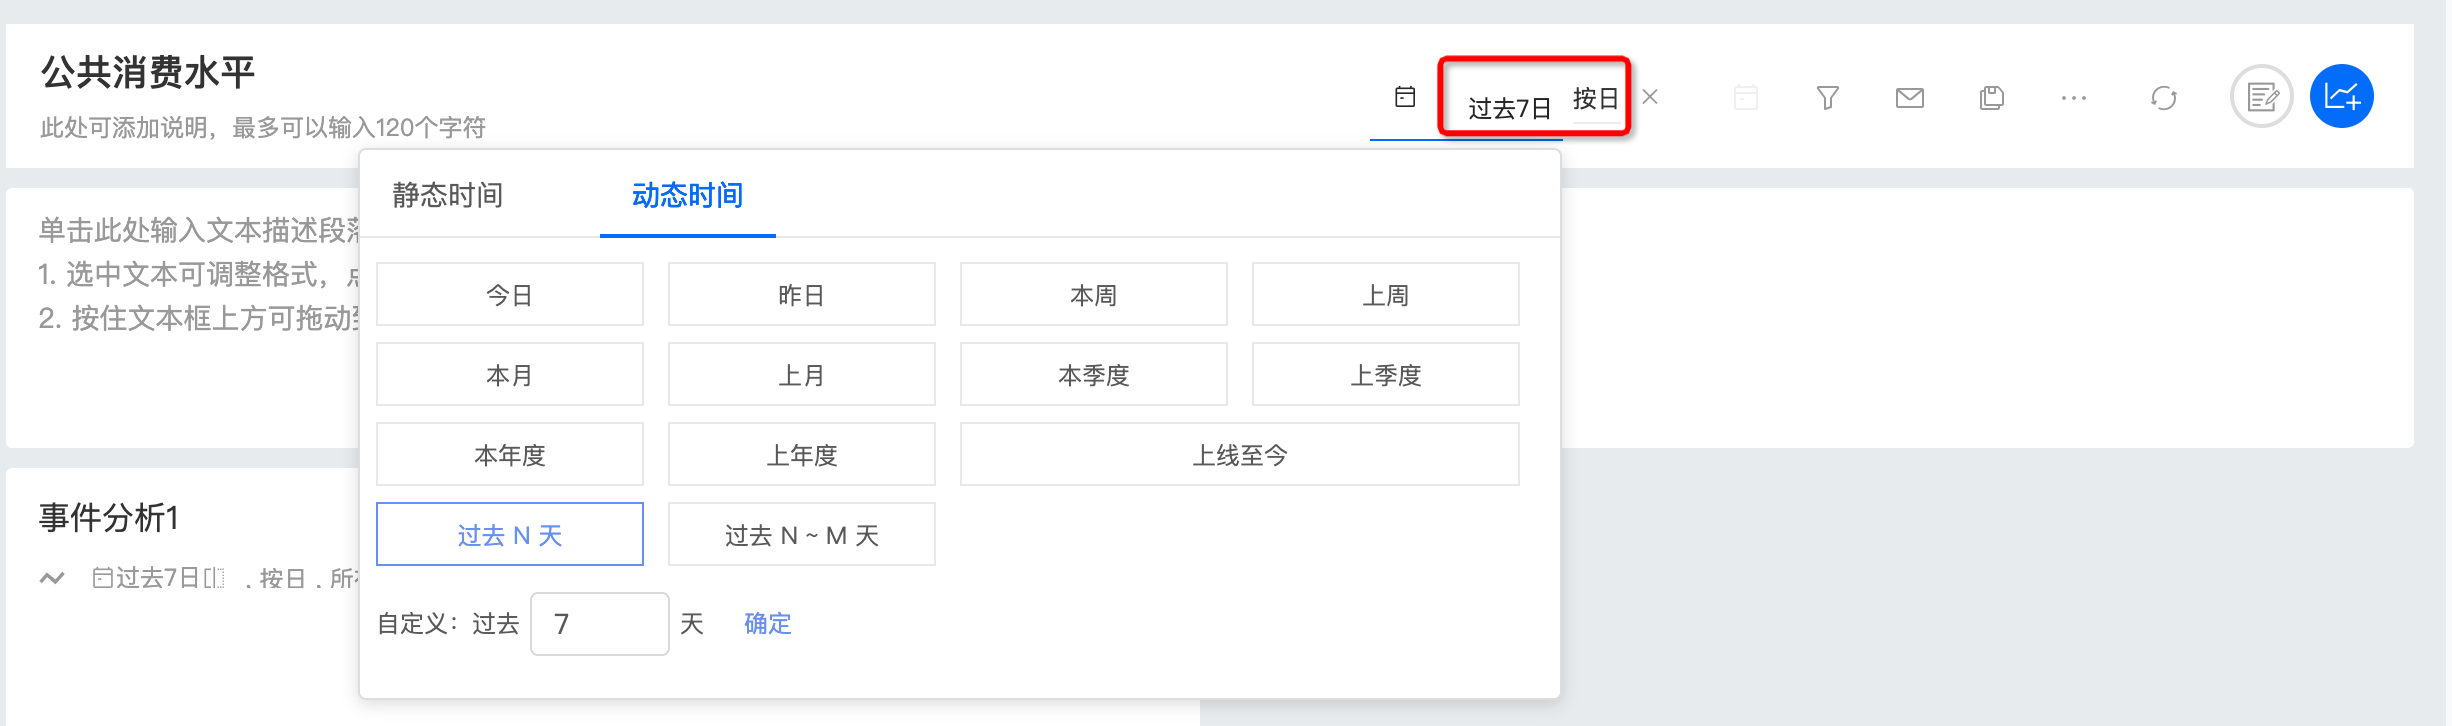
Select a Temporary Time Range
The time range supports static time and dynamic time. The period supports minute, hour, day, week, and month.
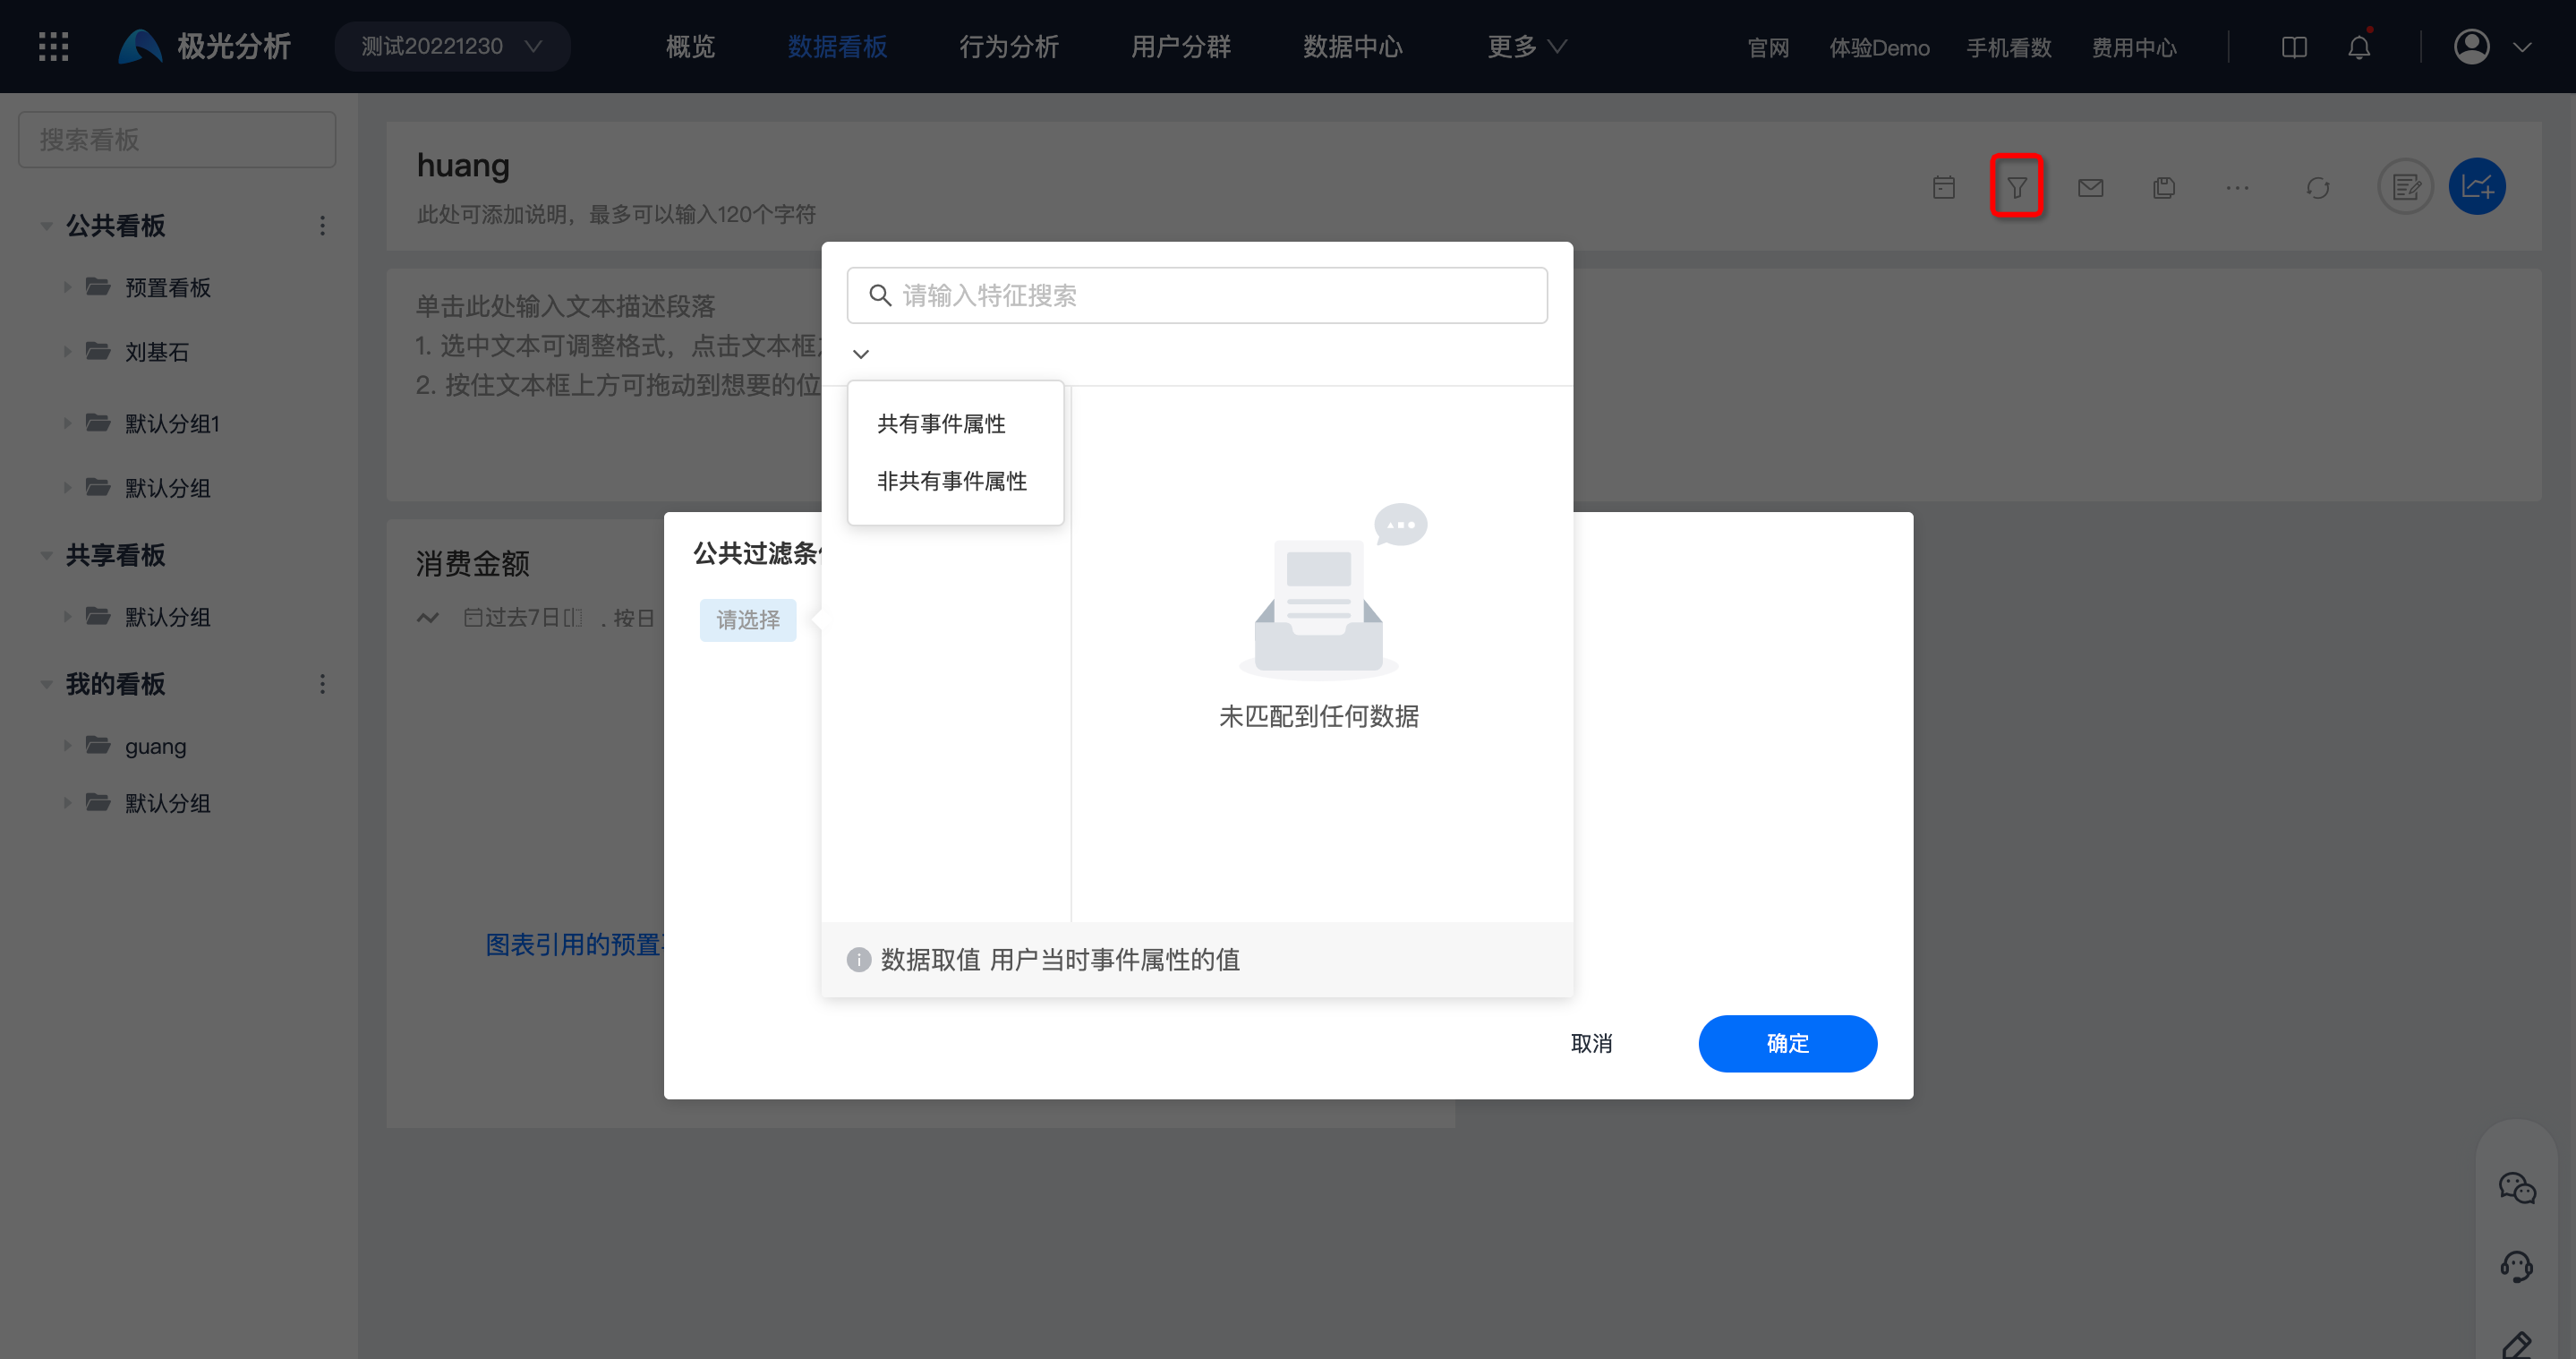
Set Common Filter Conditions
- Filter analysis charts in the dashboard, excluding user segments, by user attributes or user labels.
- Filter analysis charts in the dashboard, excluding user segments, by common attributes of their referenced events. For example, event A has event attributes a, b, and c, and event B has event attributes a, b, and d. Event attributes a and b are common attributes of events A and B.
Notes:
If non-common event attributes are used for filtering, some charts may fail to query because the filter conditions do not match.
Label filtering currently takes effect only for event, retention, funnel, and user attribute analysis charts. Other analysis charts may fail to query because the filter conditions do not match.
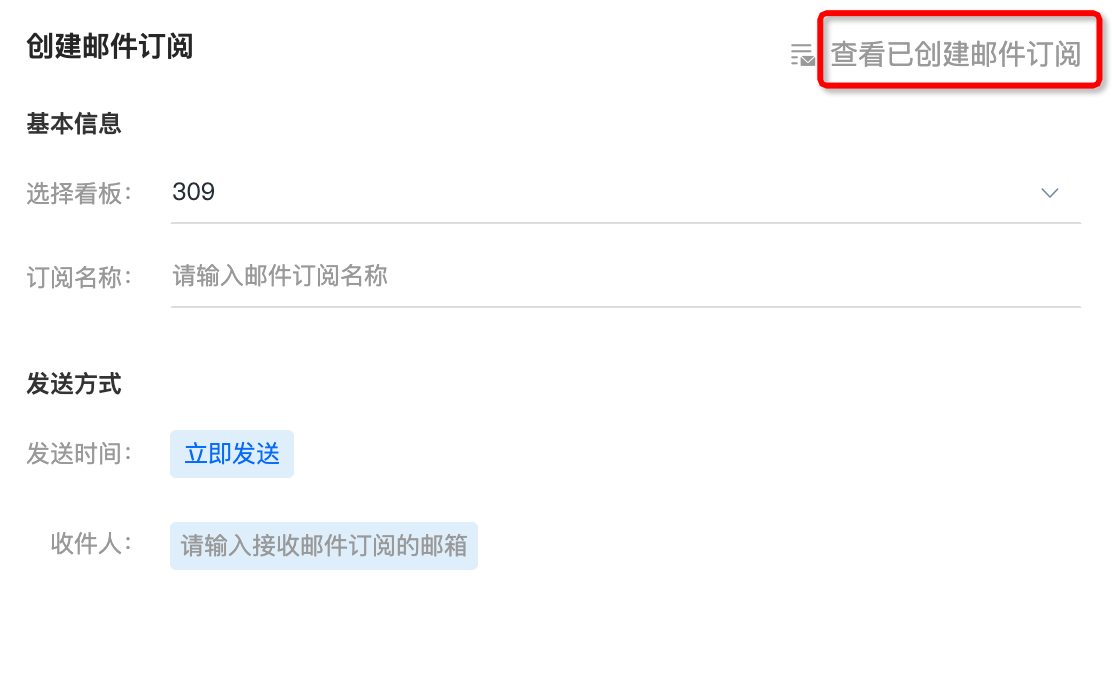
Create Email Subscription
Select a dashboard that already has charts added, and fill in the subscription name.
Select the sending time. Immediate sending, daily sending, and weekly sending are supported.
Fill in the email address that receives the email subscription.
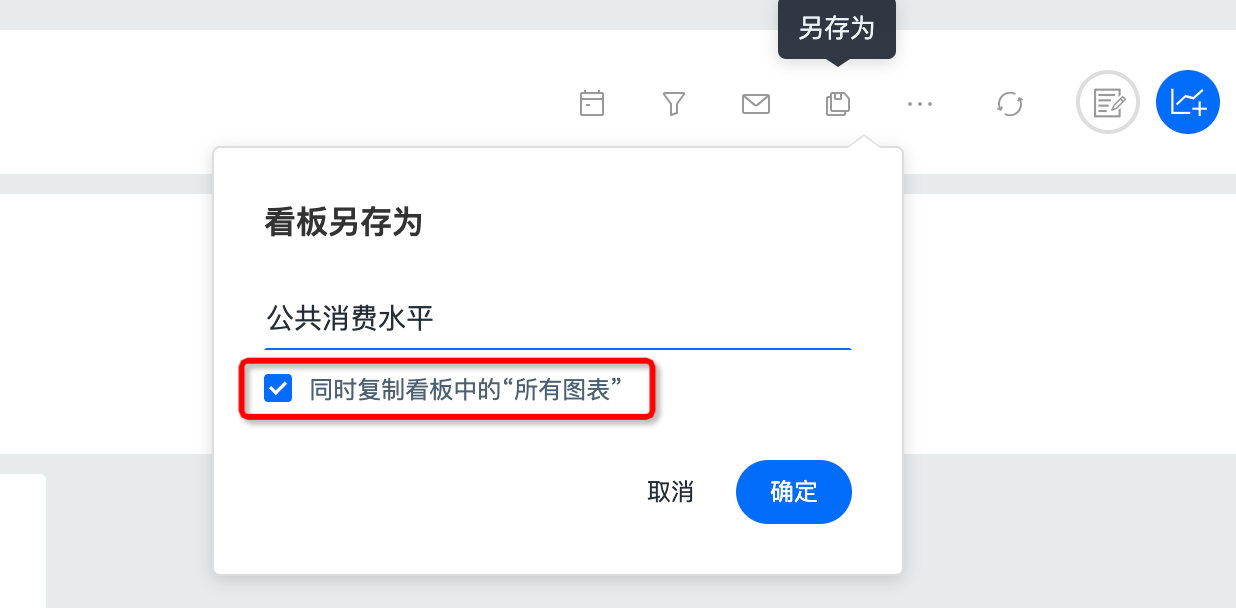
Save Dashboard As
Save As can copy a dashboard and supports selecting "all charts" in the dashboard at the same time.
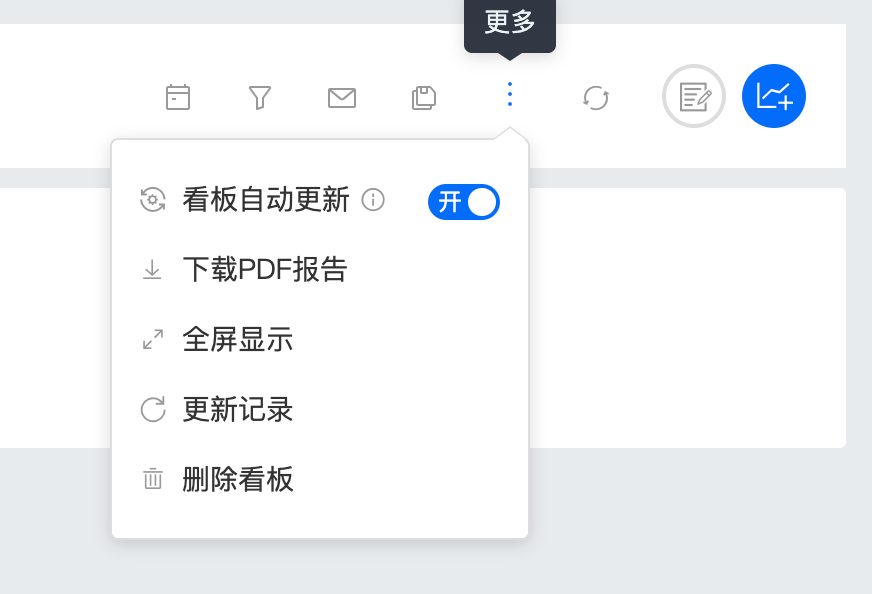
More
Supports setting dashboard auto update, downloading PDF reports, full-screen display, update records, and deleting dashboards.
- After auto update is enabled, dashboard data updates start at 00:00 every day by default. Note: charts whose time range includes "today" will not be automatically updated at 00:00. You can still use "Force Refresh Data" for real-time updates. It is recommended to enable auto update only for dashboards that need daily monitoring.
- After auto update is disabled, you can use "Force Refresh Data" for real-time dashboard updates. For dashboards that do not need daily monitoring, it is recommended to disable auto update to reduce unnecessary computing resource consumption.
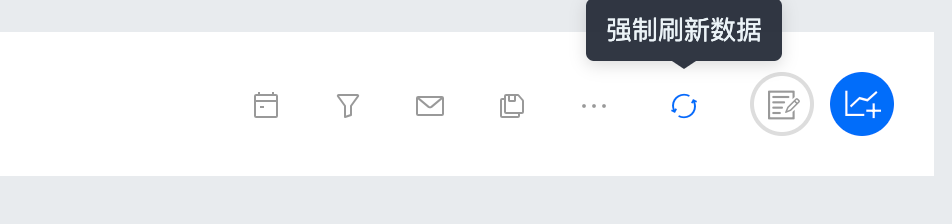
Force Refresh Data
After auto update is disabled, you can use "Force Refresh Data" for real-time dashboard updates.
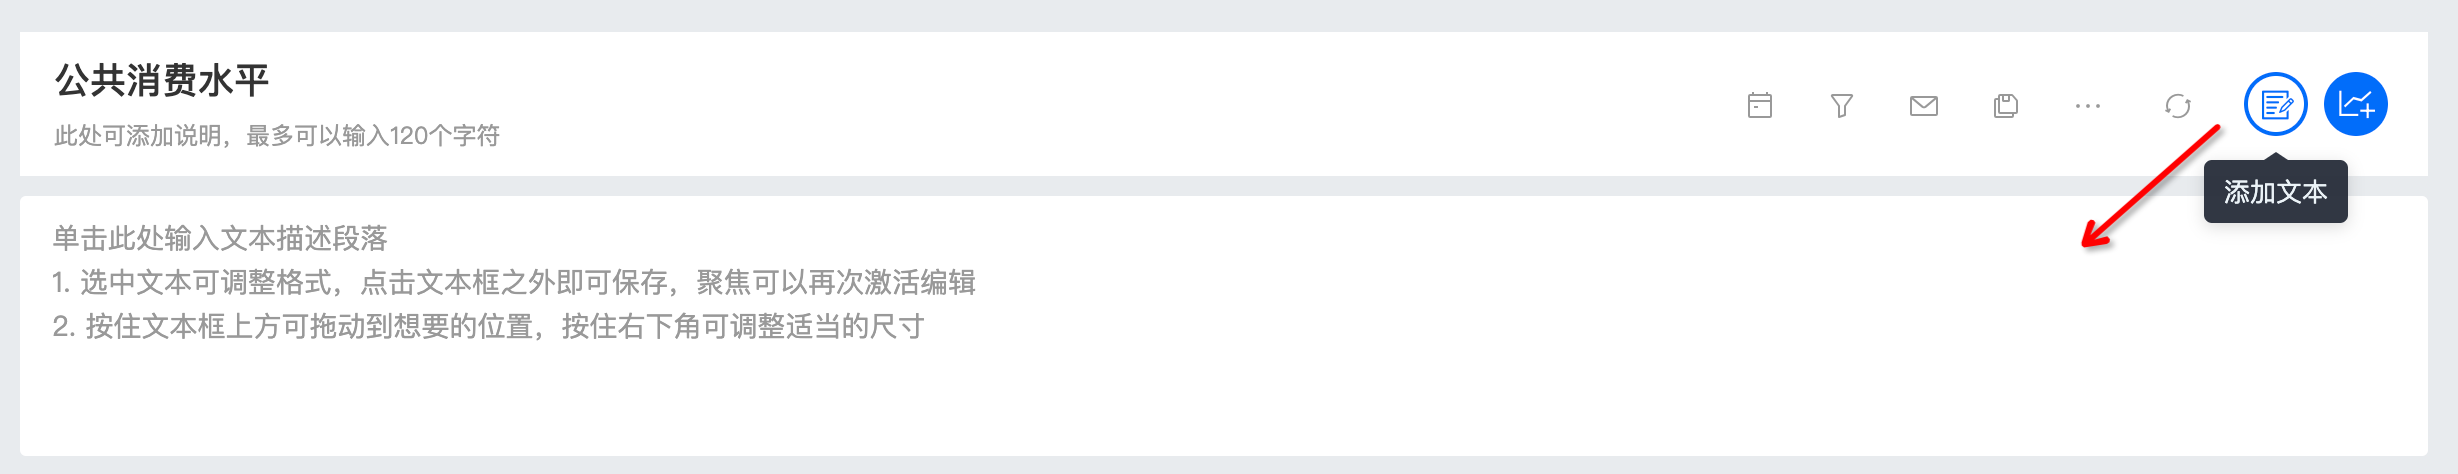
Add Text
Click to enter a text description paragraph.
Select text to adjust the format. Click outside the text box to save. Focus the text box again to activate editing.
Hold the top of the text box to drag it to the desired position, and hold the lower-right corner to adjust it to an appropriate size.
Add Charts
See Create a Dashboard.
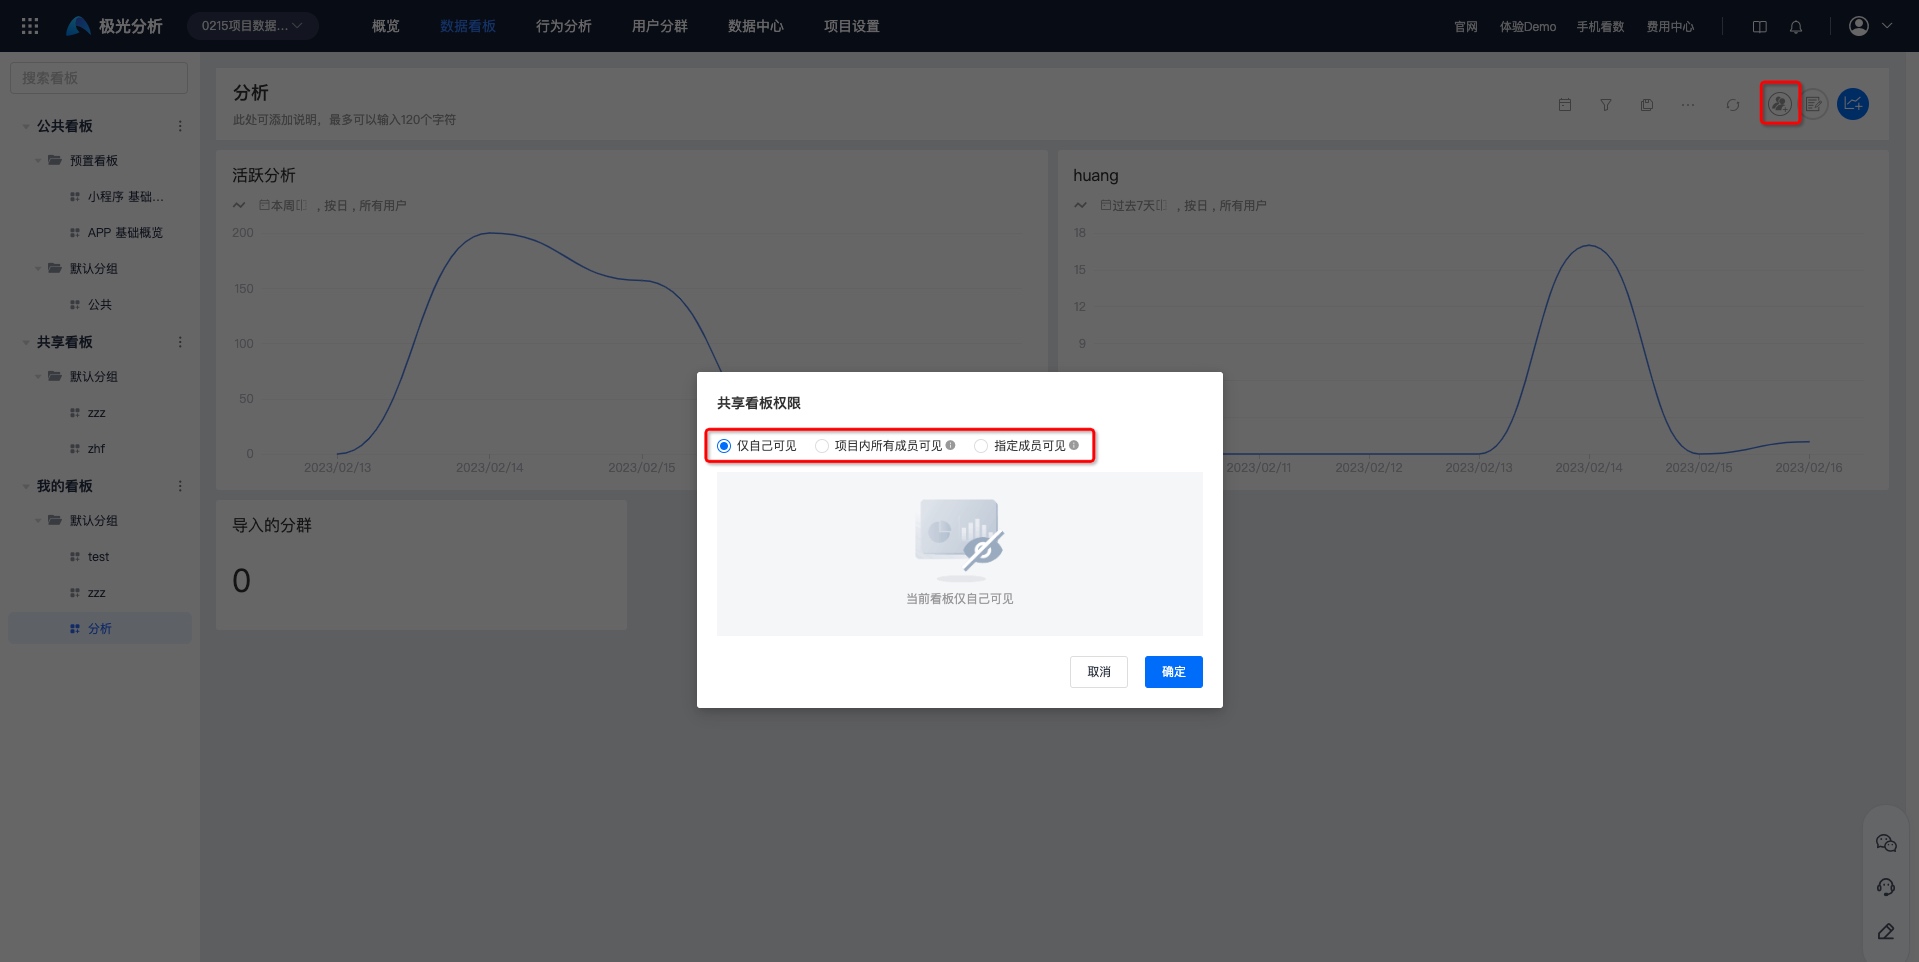
Add Sharing
In [My Dashboard], you can set dashboard sharing permissions. Supported permissions are visible only to me, visible to all members in the project, and visible to specified members. Users granted permissions can view this dashboard in shared dashboards.
Visible to all members in the project: new members added to the project later will be included by default and assigned the
role. You can search for users to modify permissions separately. Visible to specified members: you can search and add specific users/roles and grant permissions.