Push statistics
This article aims to introduce each statistical page of push statistics to facilitate users to quickly query statistical data.
Push AI analysis
Special note: If you are a VIP customer, you can Contact Business to apply to experience the AI Intelligent Analysis function, which will help you deeply understand the current status of your push data and provide you with valuable insights and suggestions!
Data Overview
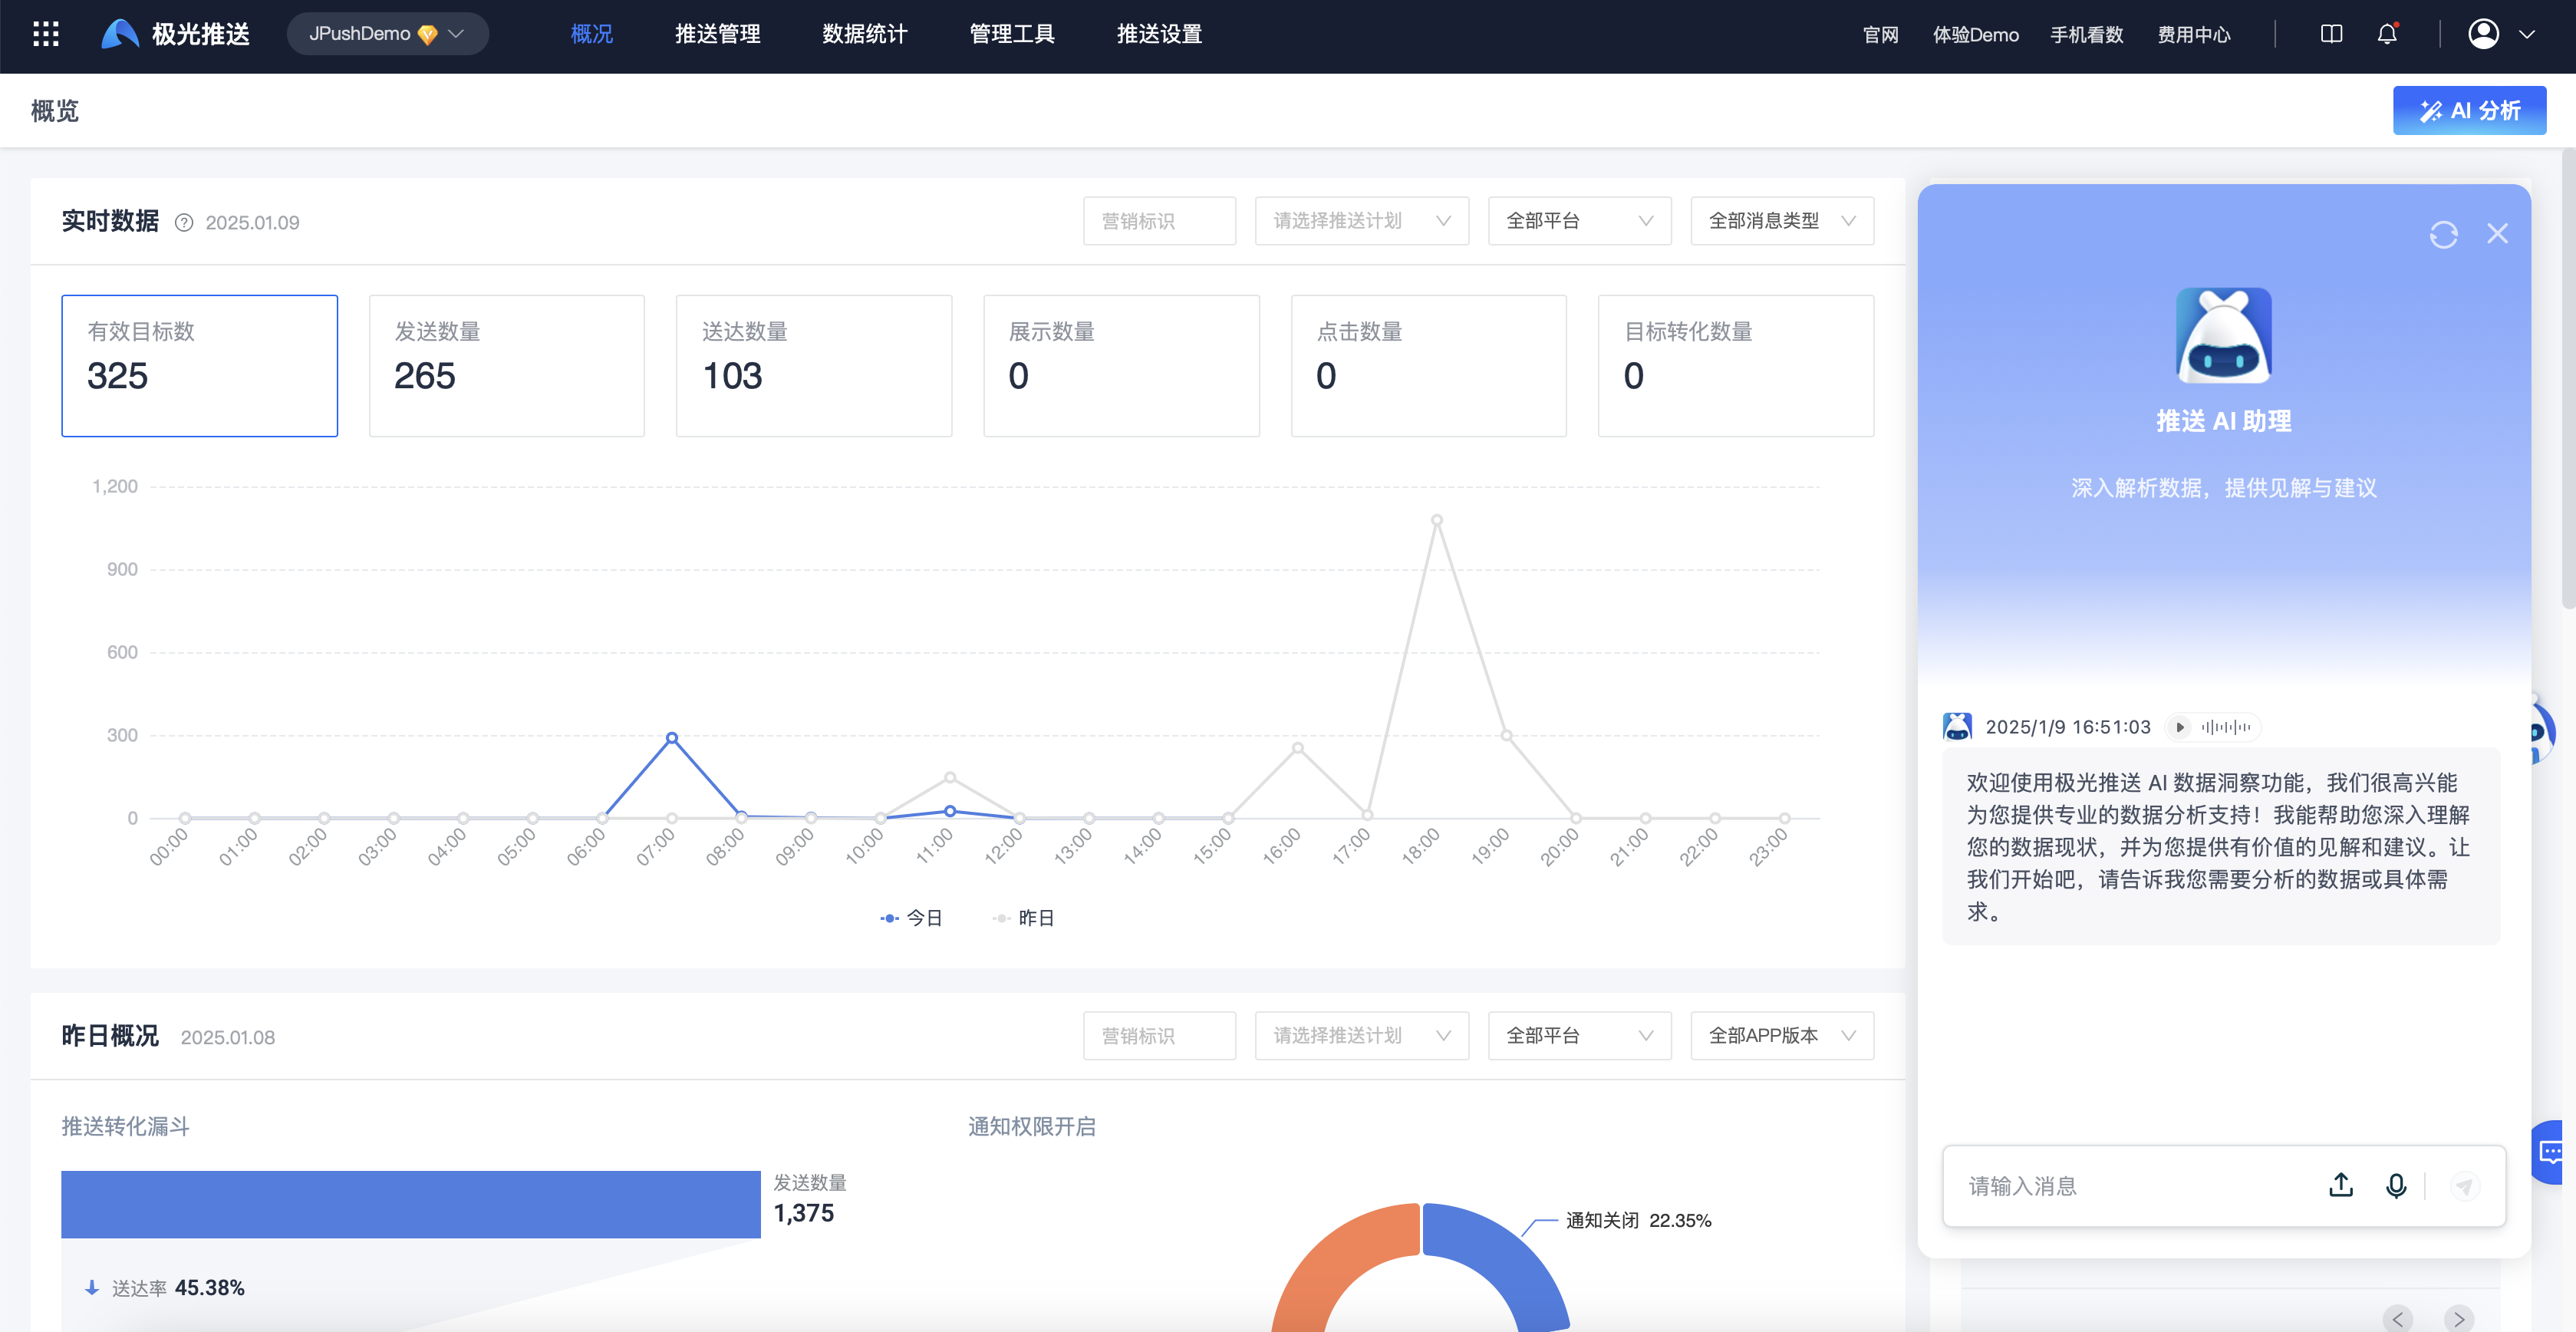
Enter the [JPush]-[Overview] page to view the application's real-time data, yesterday's overview, conversion trends and analysis of loss reasons.
Real-time data
The real-time data displays the overall push situation of the day in hourly latitude. You can click on the number of effective targets, number of sends, number of deliveries, number of impressions and number of clicks to view the corresponding trend charts.
- Number of valid targets: The number of target devices selected by the push task and filtered by validity.
- Number of sending: Among the valid target devices, the number of devices that the JiGuang server actually successfully created a sending task.
- Delivery quantity: The number of receipts for the notification message actually received by the device terminal through the JiGuang channel and manufacturer channel. The delivery quantity after 5 days is not counted. For manufacturer delivery, please refer to [Manufacturer Channel Receipt Configuration Guide] (/jpush/client/Android/android_callback).
- Number of impressions: The number of receipts successfully displayed on the device terminal after the notification message is delivered to the device terminal. The number of impressions after 5 days will not be counted.
- Number of clicks: After the notification message is successfully displayed, the number of user receipts that clicked on the notification message. The number of clicks after 5 days will not be counted.
Overview of yesterday
Yesterday's overview displays the push conversion funnel and notification permission status distribution, making it easier for users to understand the overall conversion of yesterday's push.
Conversion Trends
Conversion trends can view trend charts of delivery rate, display rate, and click-through rate within the selected period, allowing users to make operational push adjustments based on the data.
- Delivery rate: The sending tasks generated during this time period, the total amount delivered/the total amount sent.
- Display rate: The sending tasks generated during this time period, the total display amount/the total delivery amount.
-Click rate: The sending tasks generated during this time period, the total number of clicks/the total number of deliveries.
Analysis of causes of damage
The cause of loss can be viewed by platform to view the specific reasons for loss at each stage, helping users quickly locate the cause, adjust push parameters and push targets in a timely manner, and improve the conversion rate. 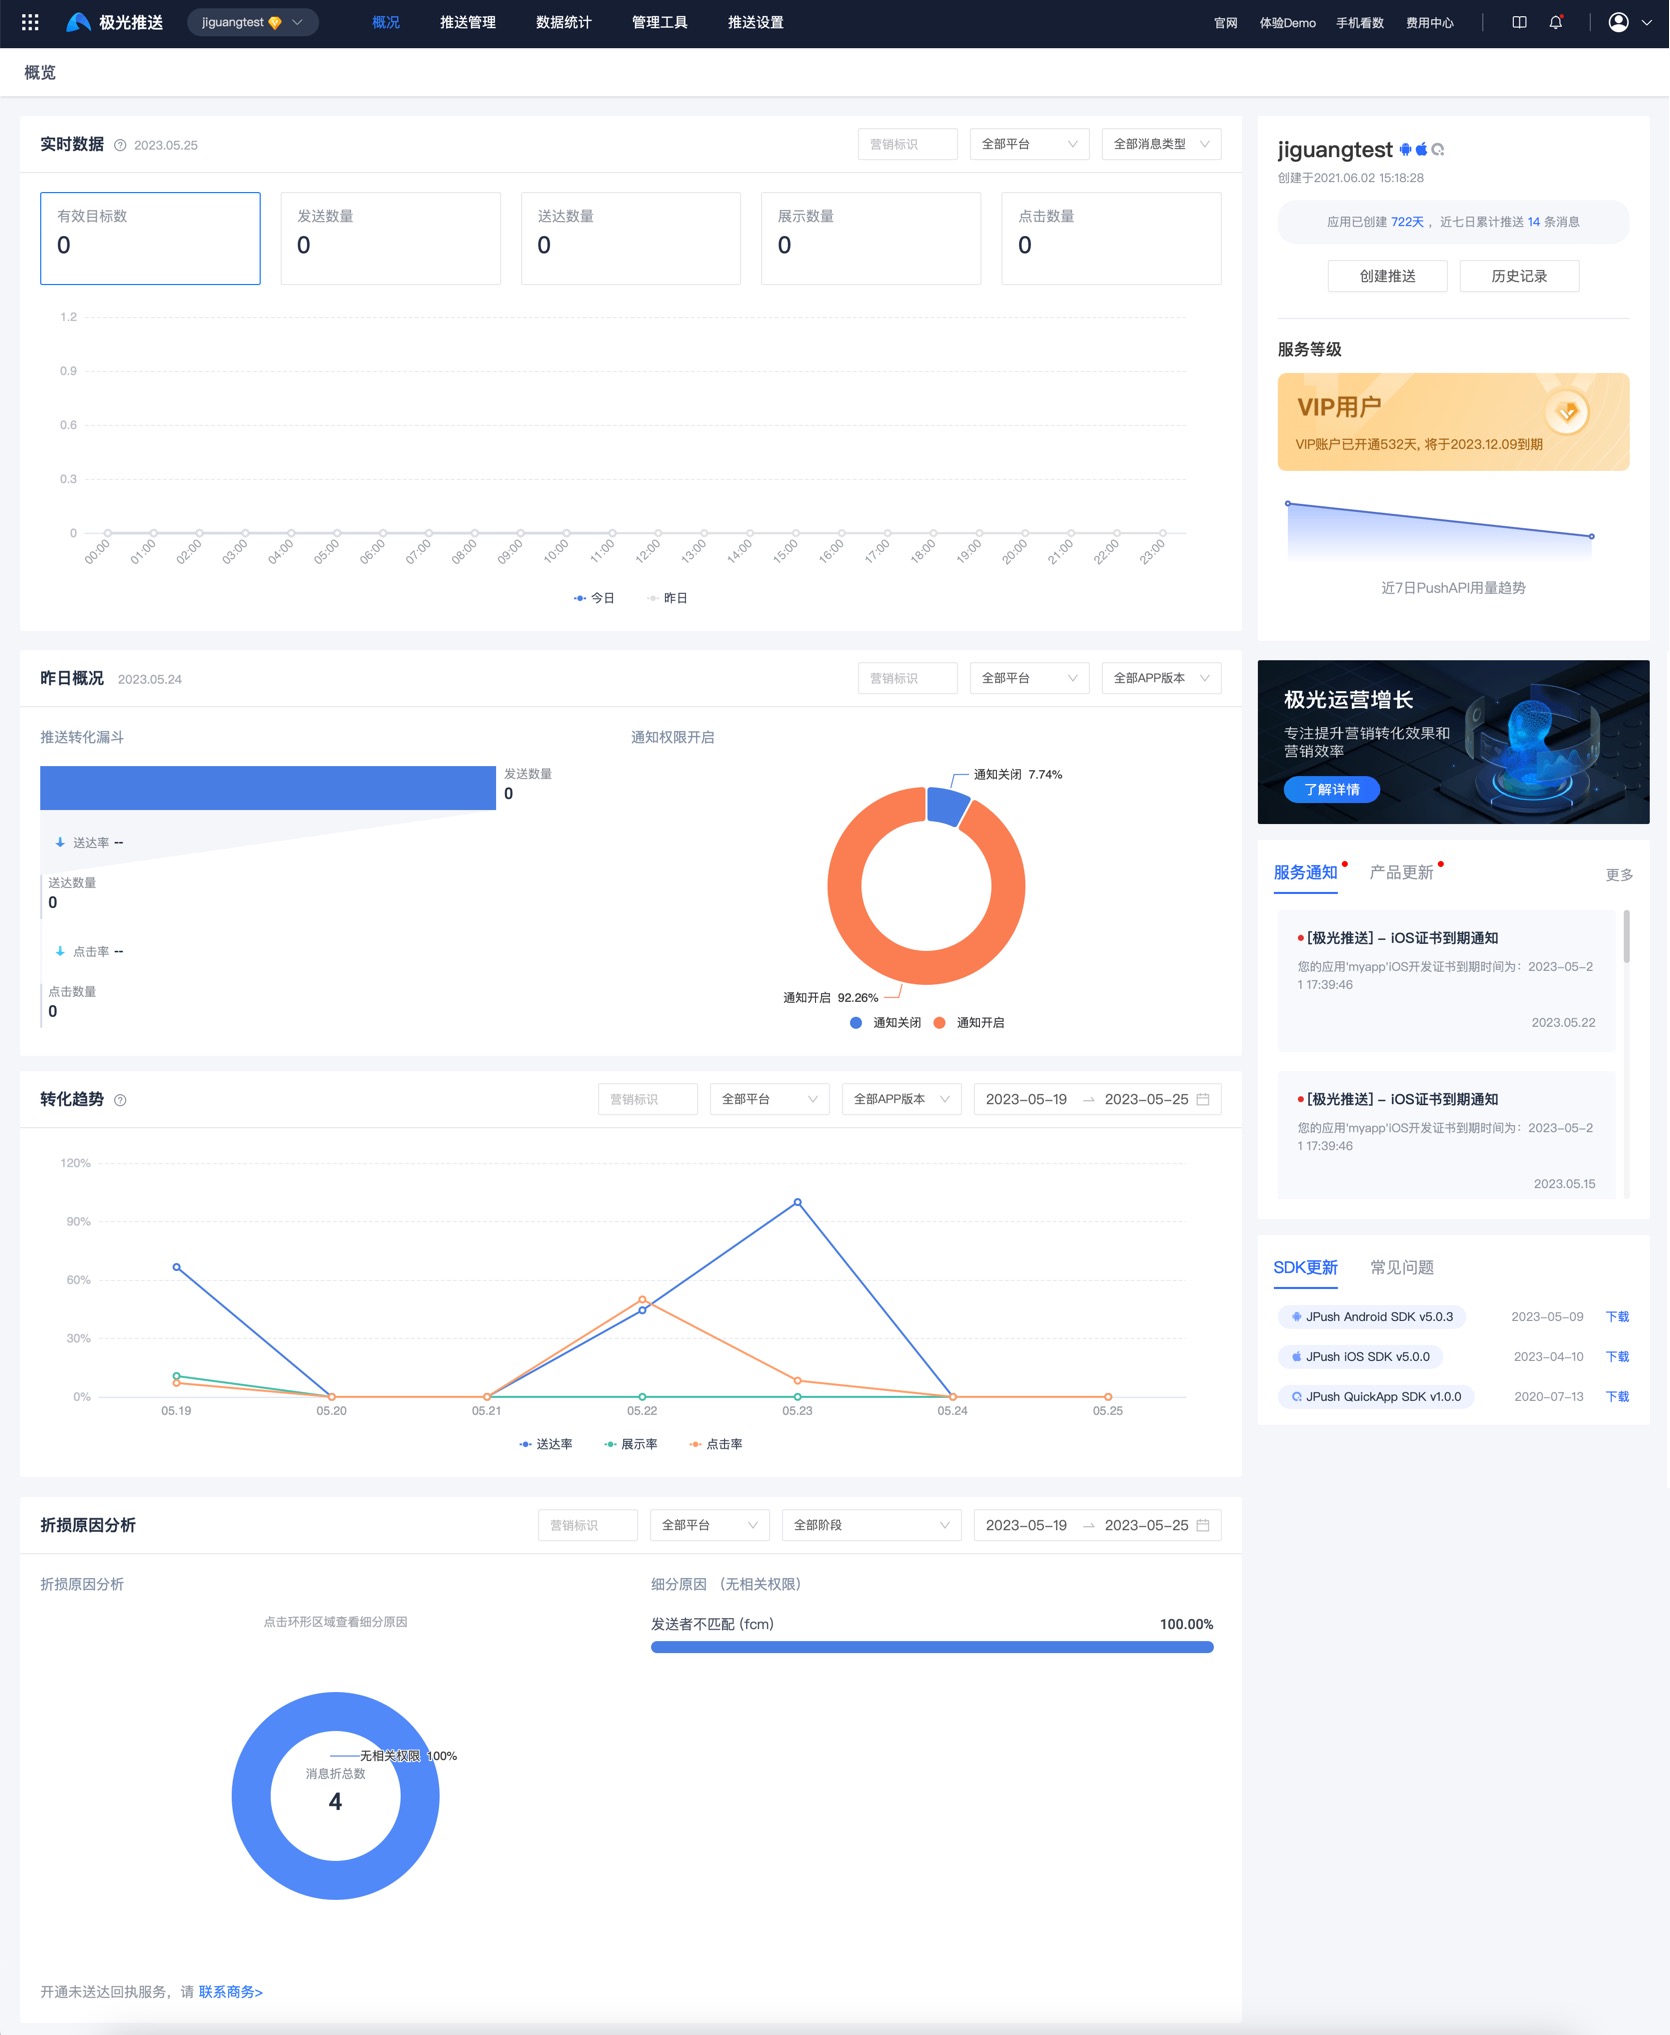
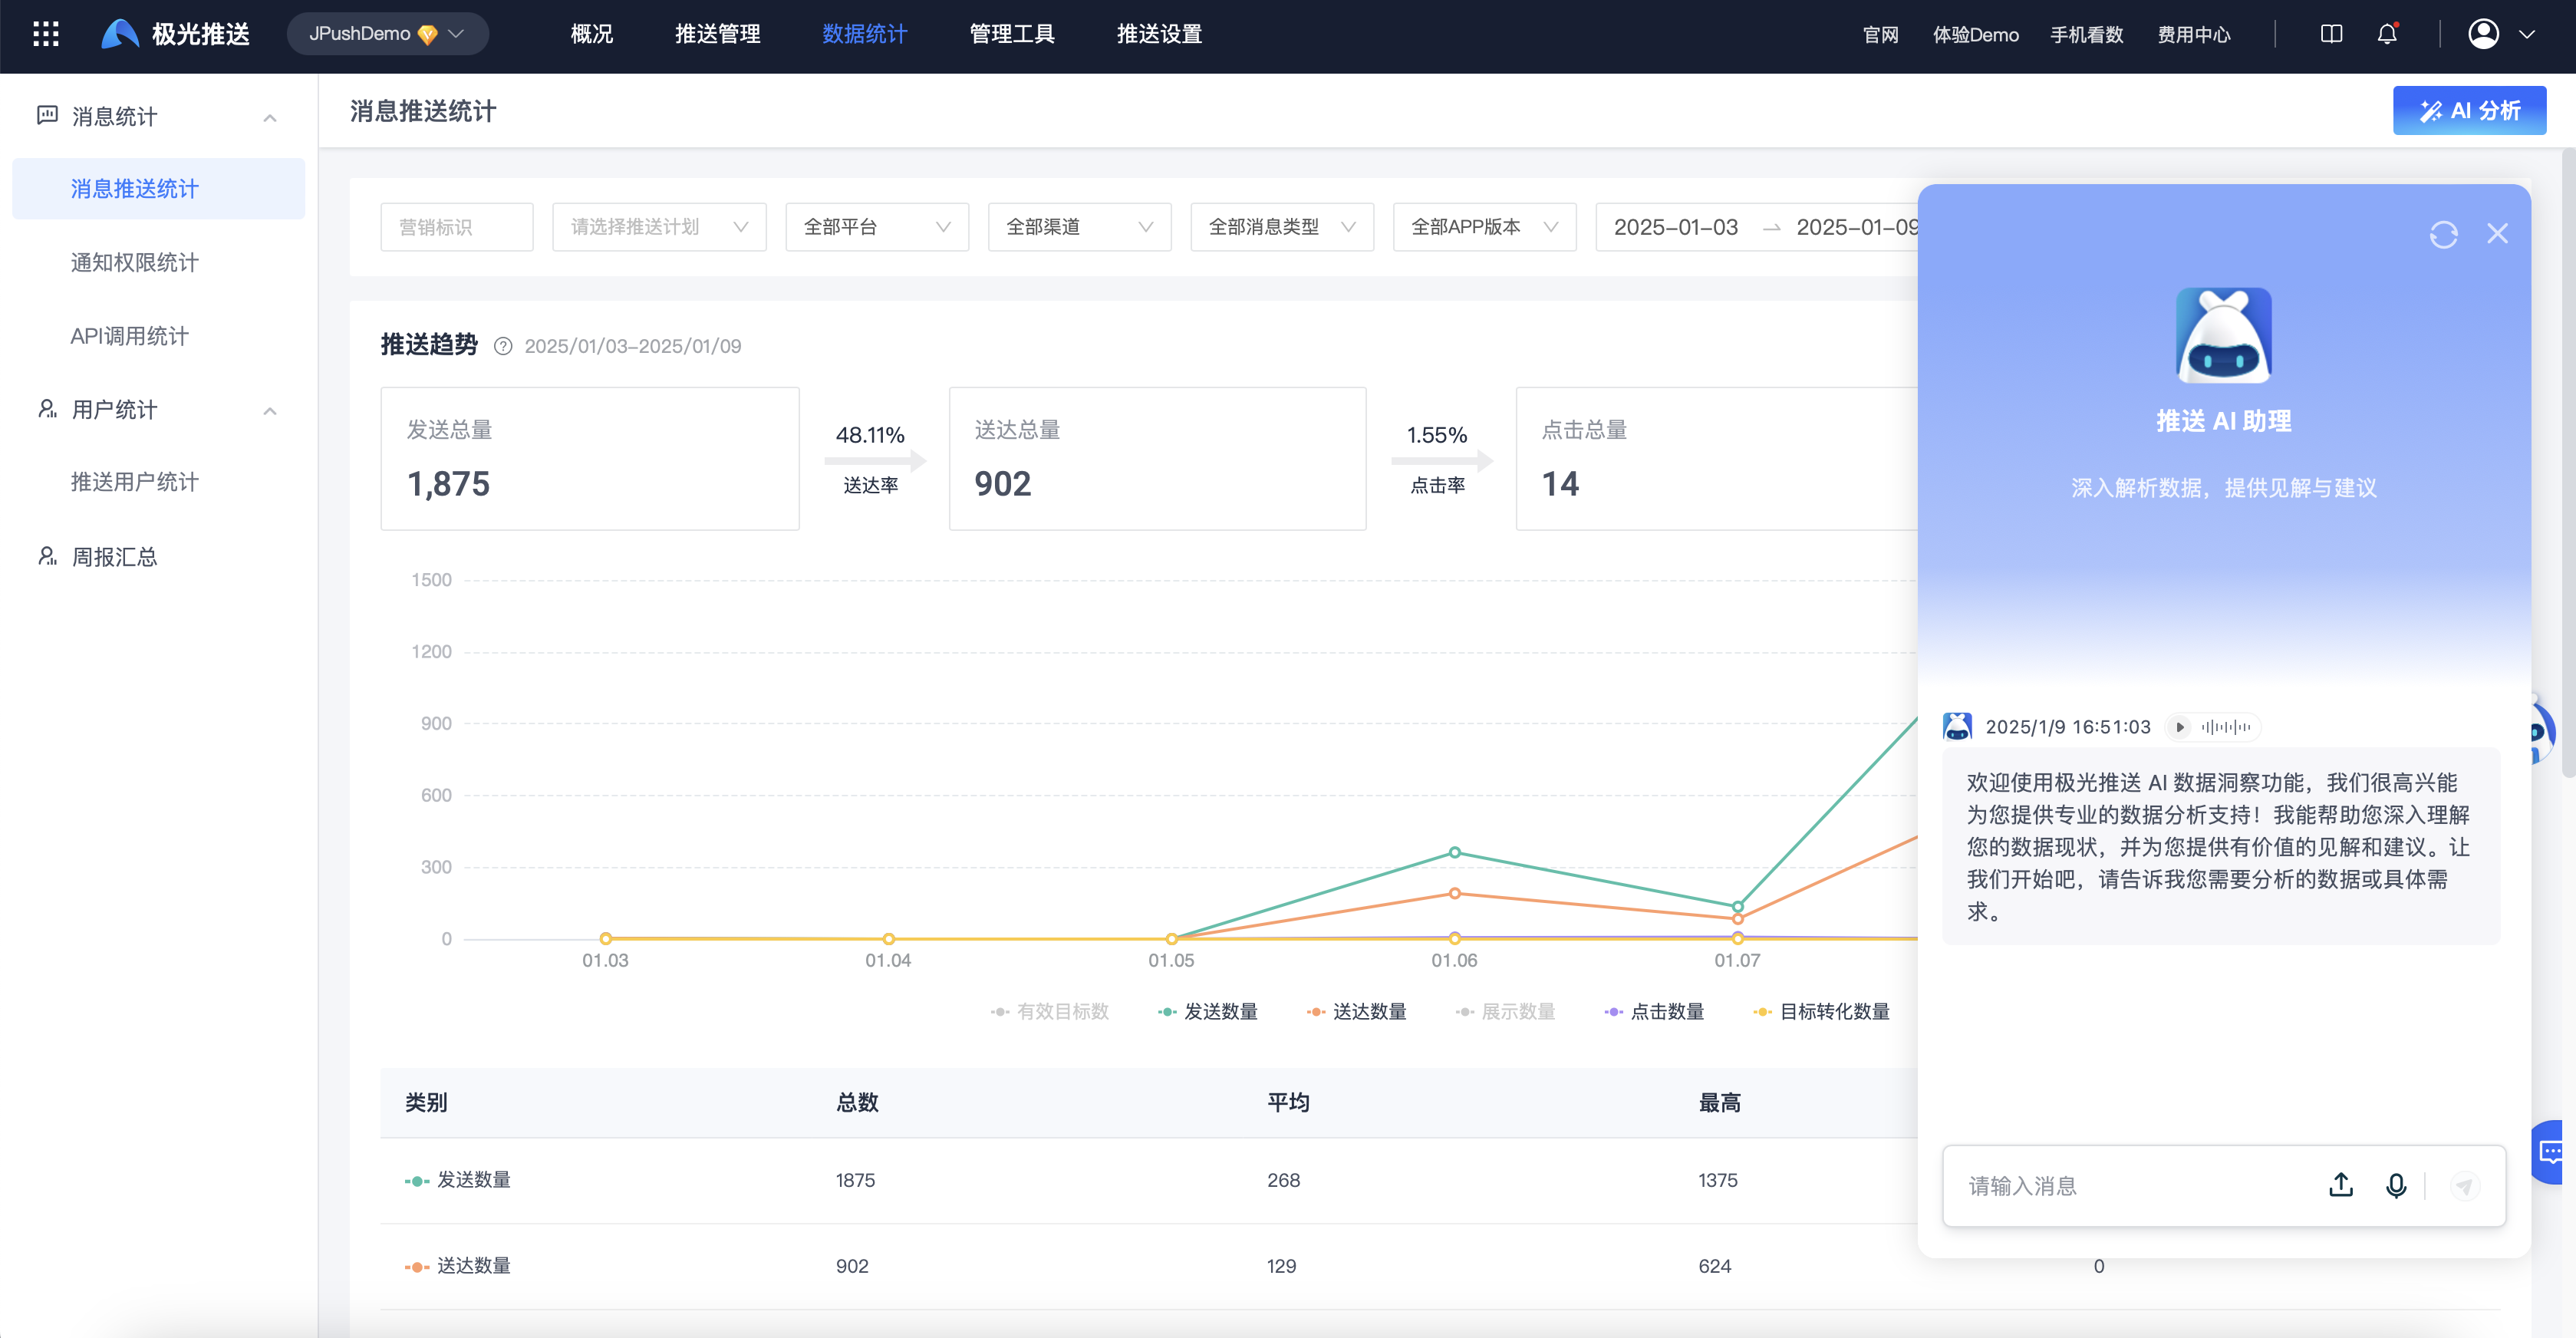
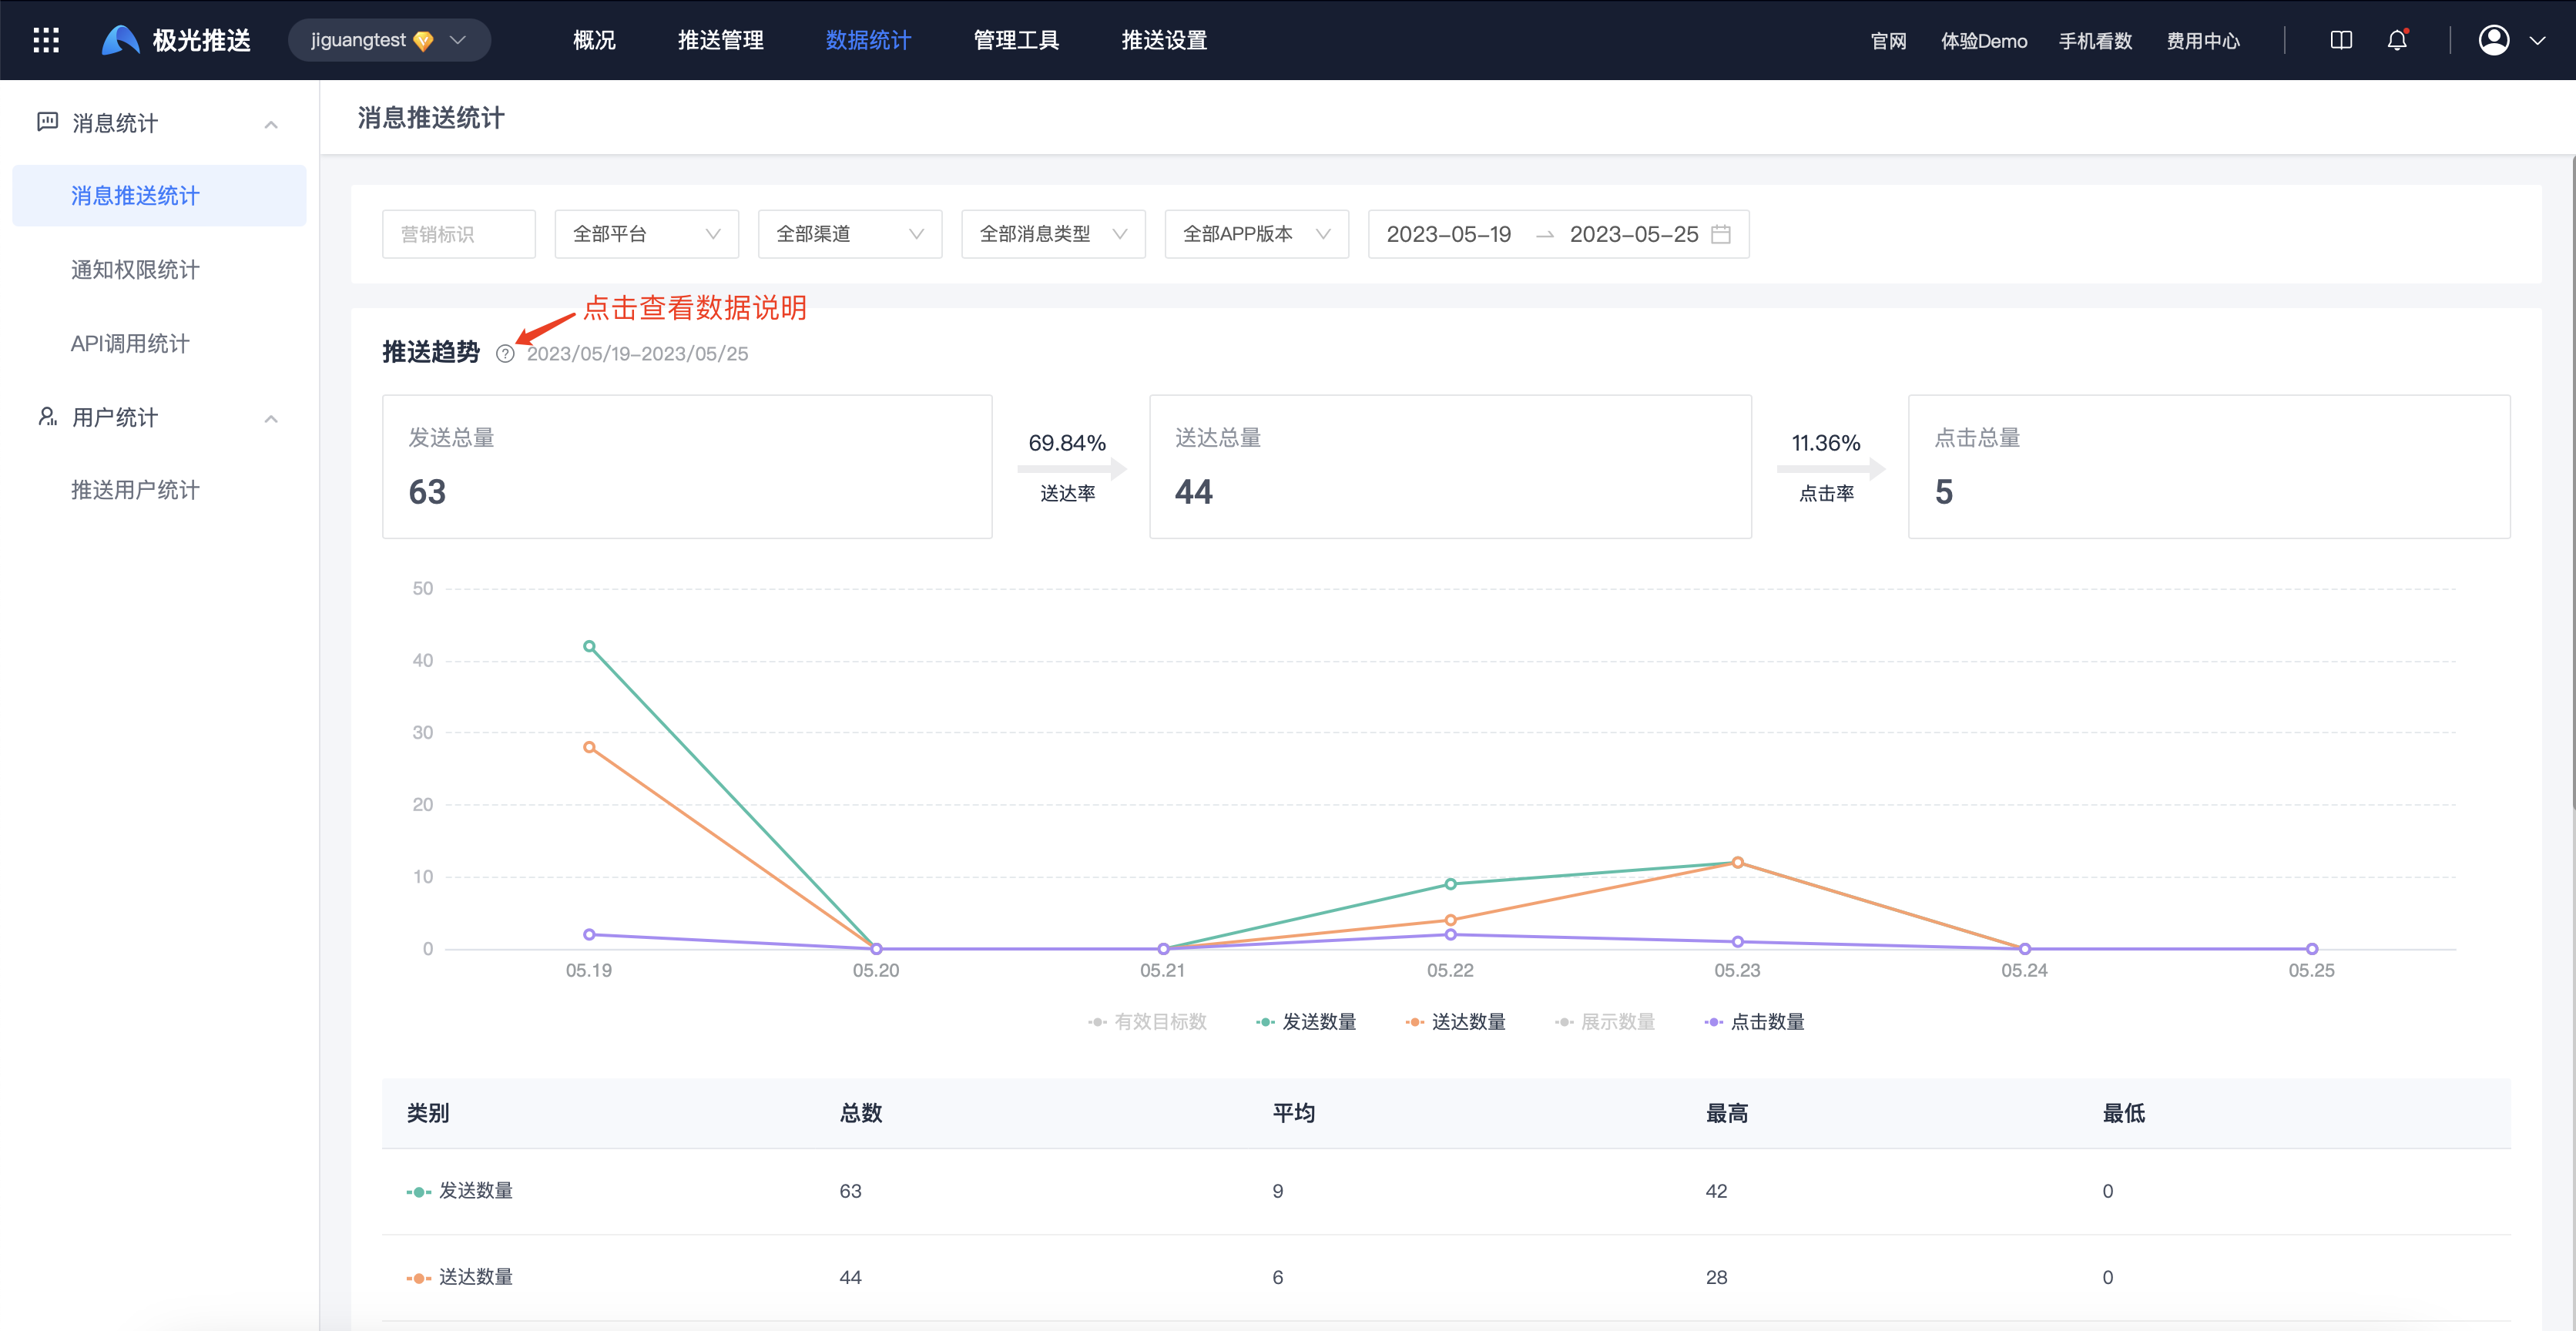
Message push statistics
Enter the [Message Push]-[Statistical Analysis]-[Push Statistics]-[Message Push Statistics] page to view push trends within the selected period.
Click "?" to view detailed data description.
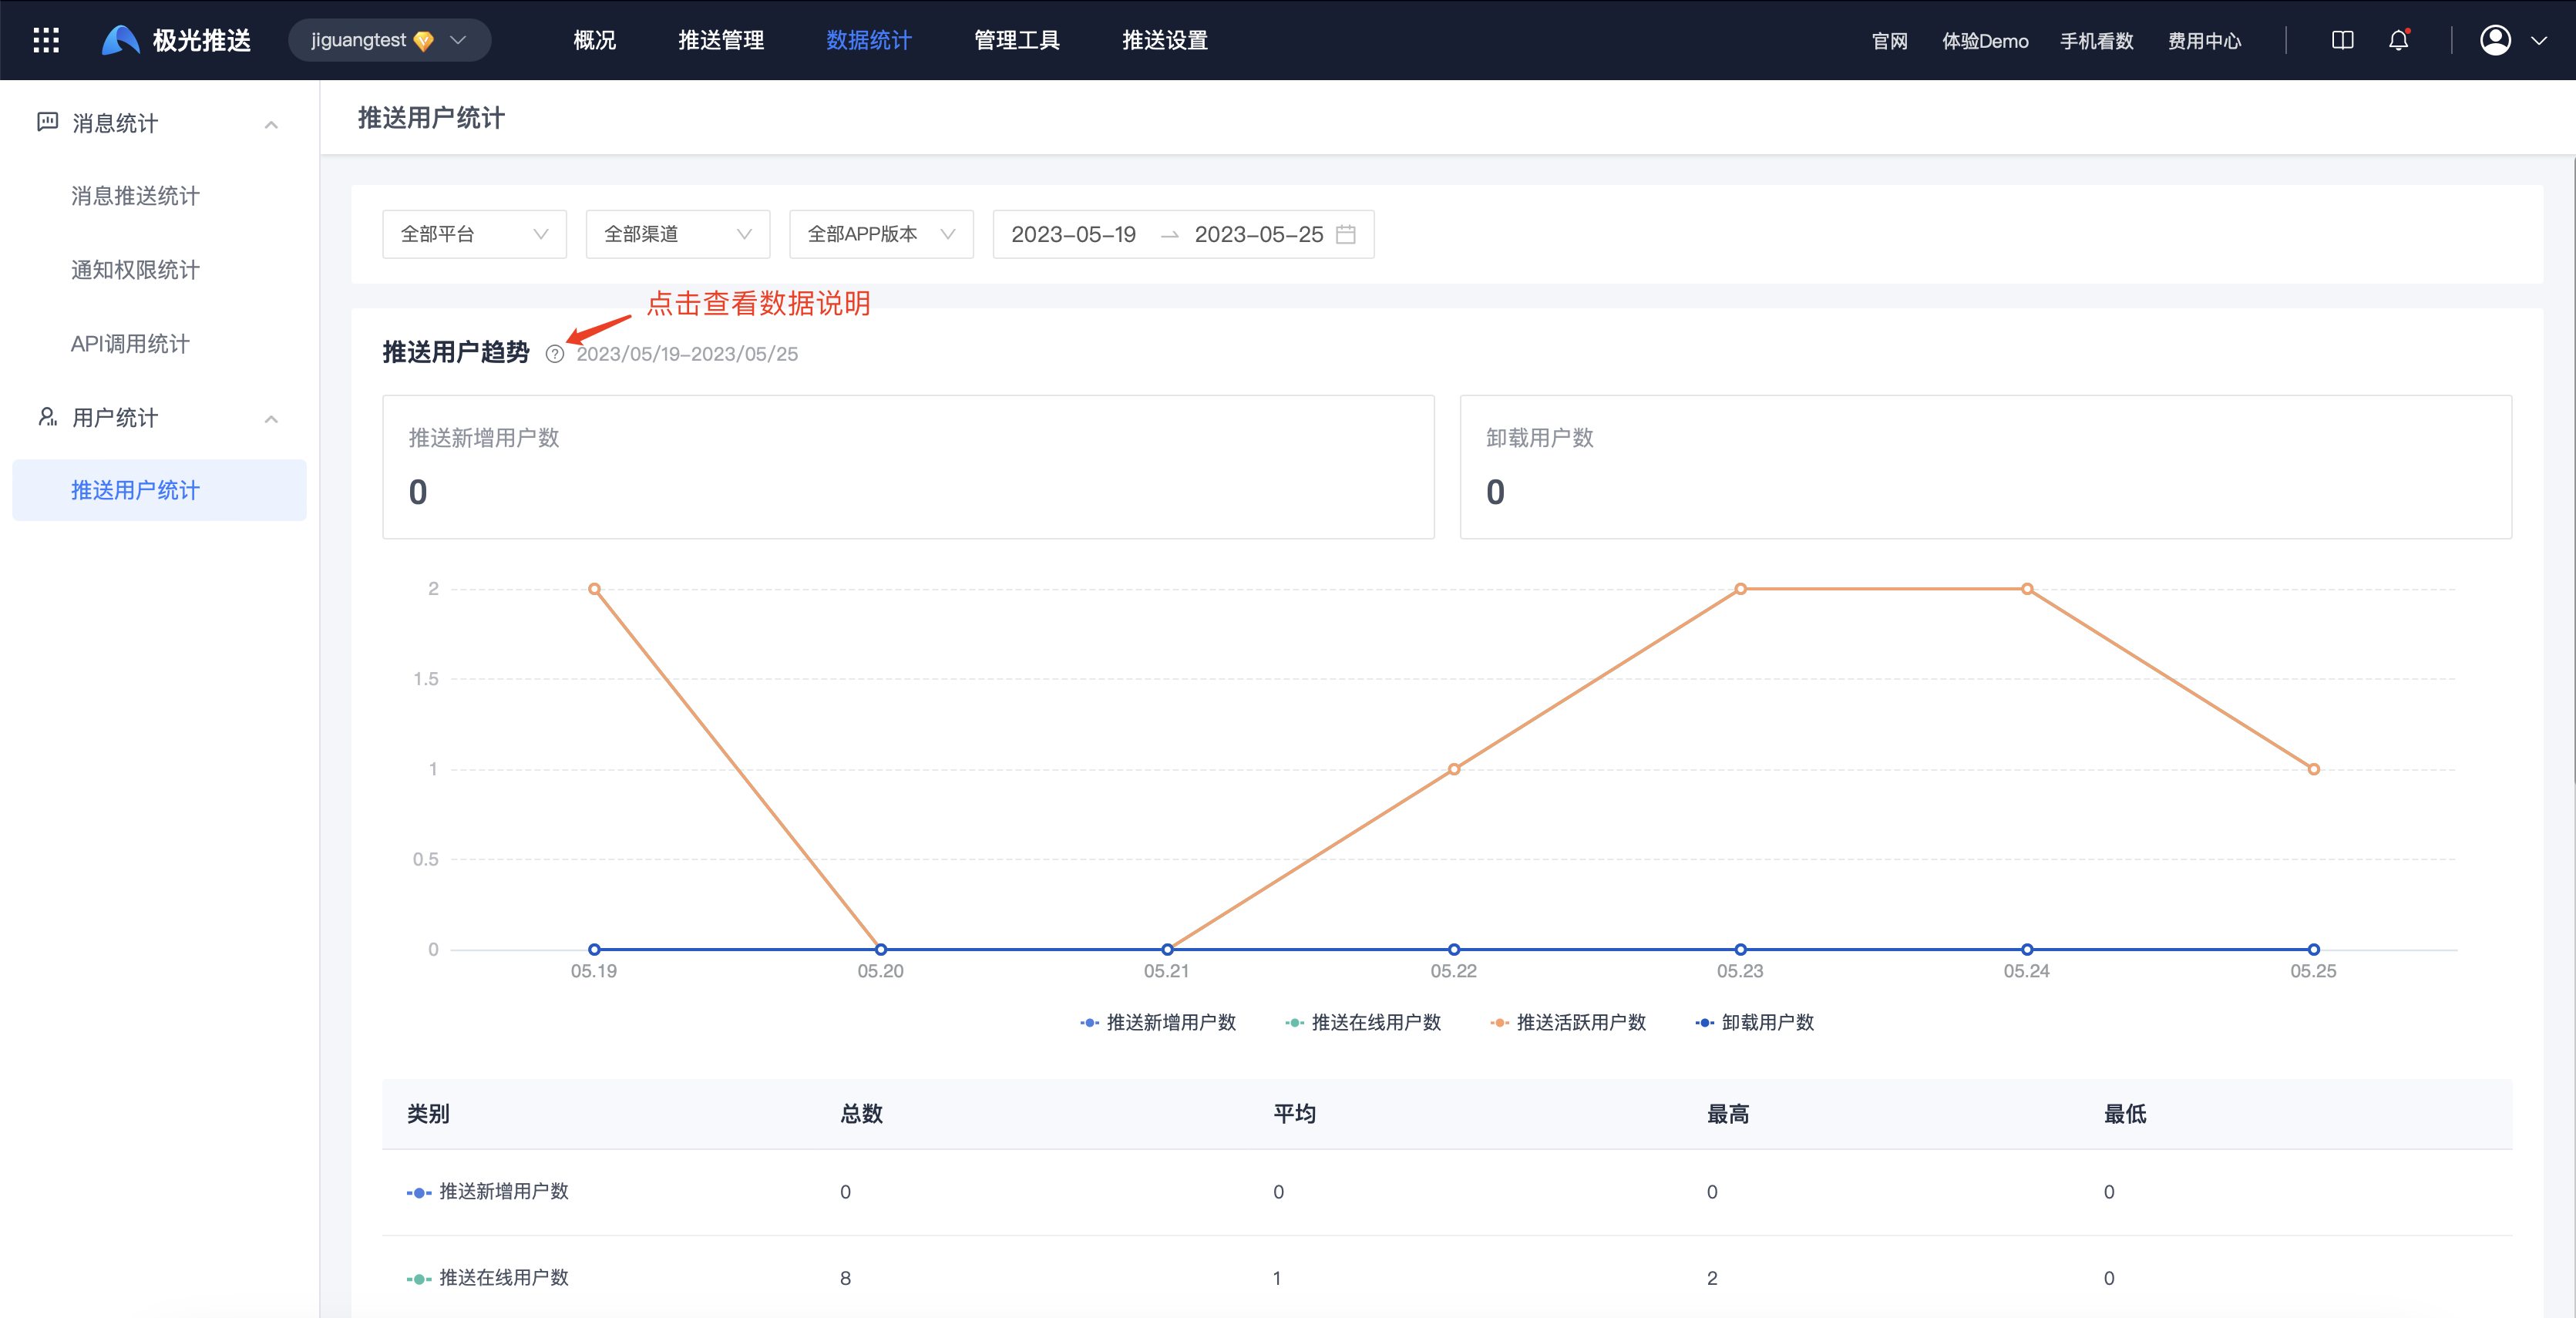
Push user statistics
Enter the [Message Push]-[Statistical Analysis]-[Push Statistics]-[Push User Statistics] page to view the trend and detailed data of push users in the selected period.
- Push new users: newly registered jpush sdk users.
- Online users: users who have successfully established a network connection between Jpush SDK and jpush server (without distinguishing between front and back).
- Active users: Users whose application has been run in the foreground of the device.
- Users who turn off notifications: Users who turn off notification permissions for this application.
- Users who uninstalled: Jiguang detected users who uninstalled this application and could not distinguish between channels and APP versions.
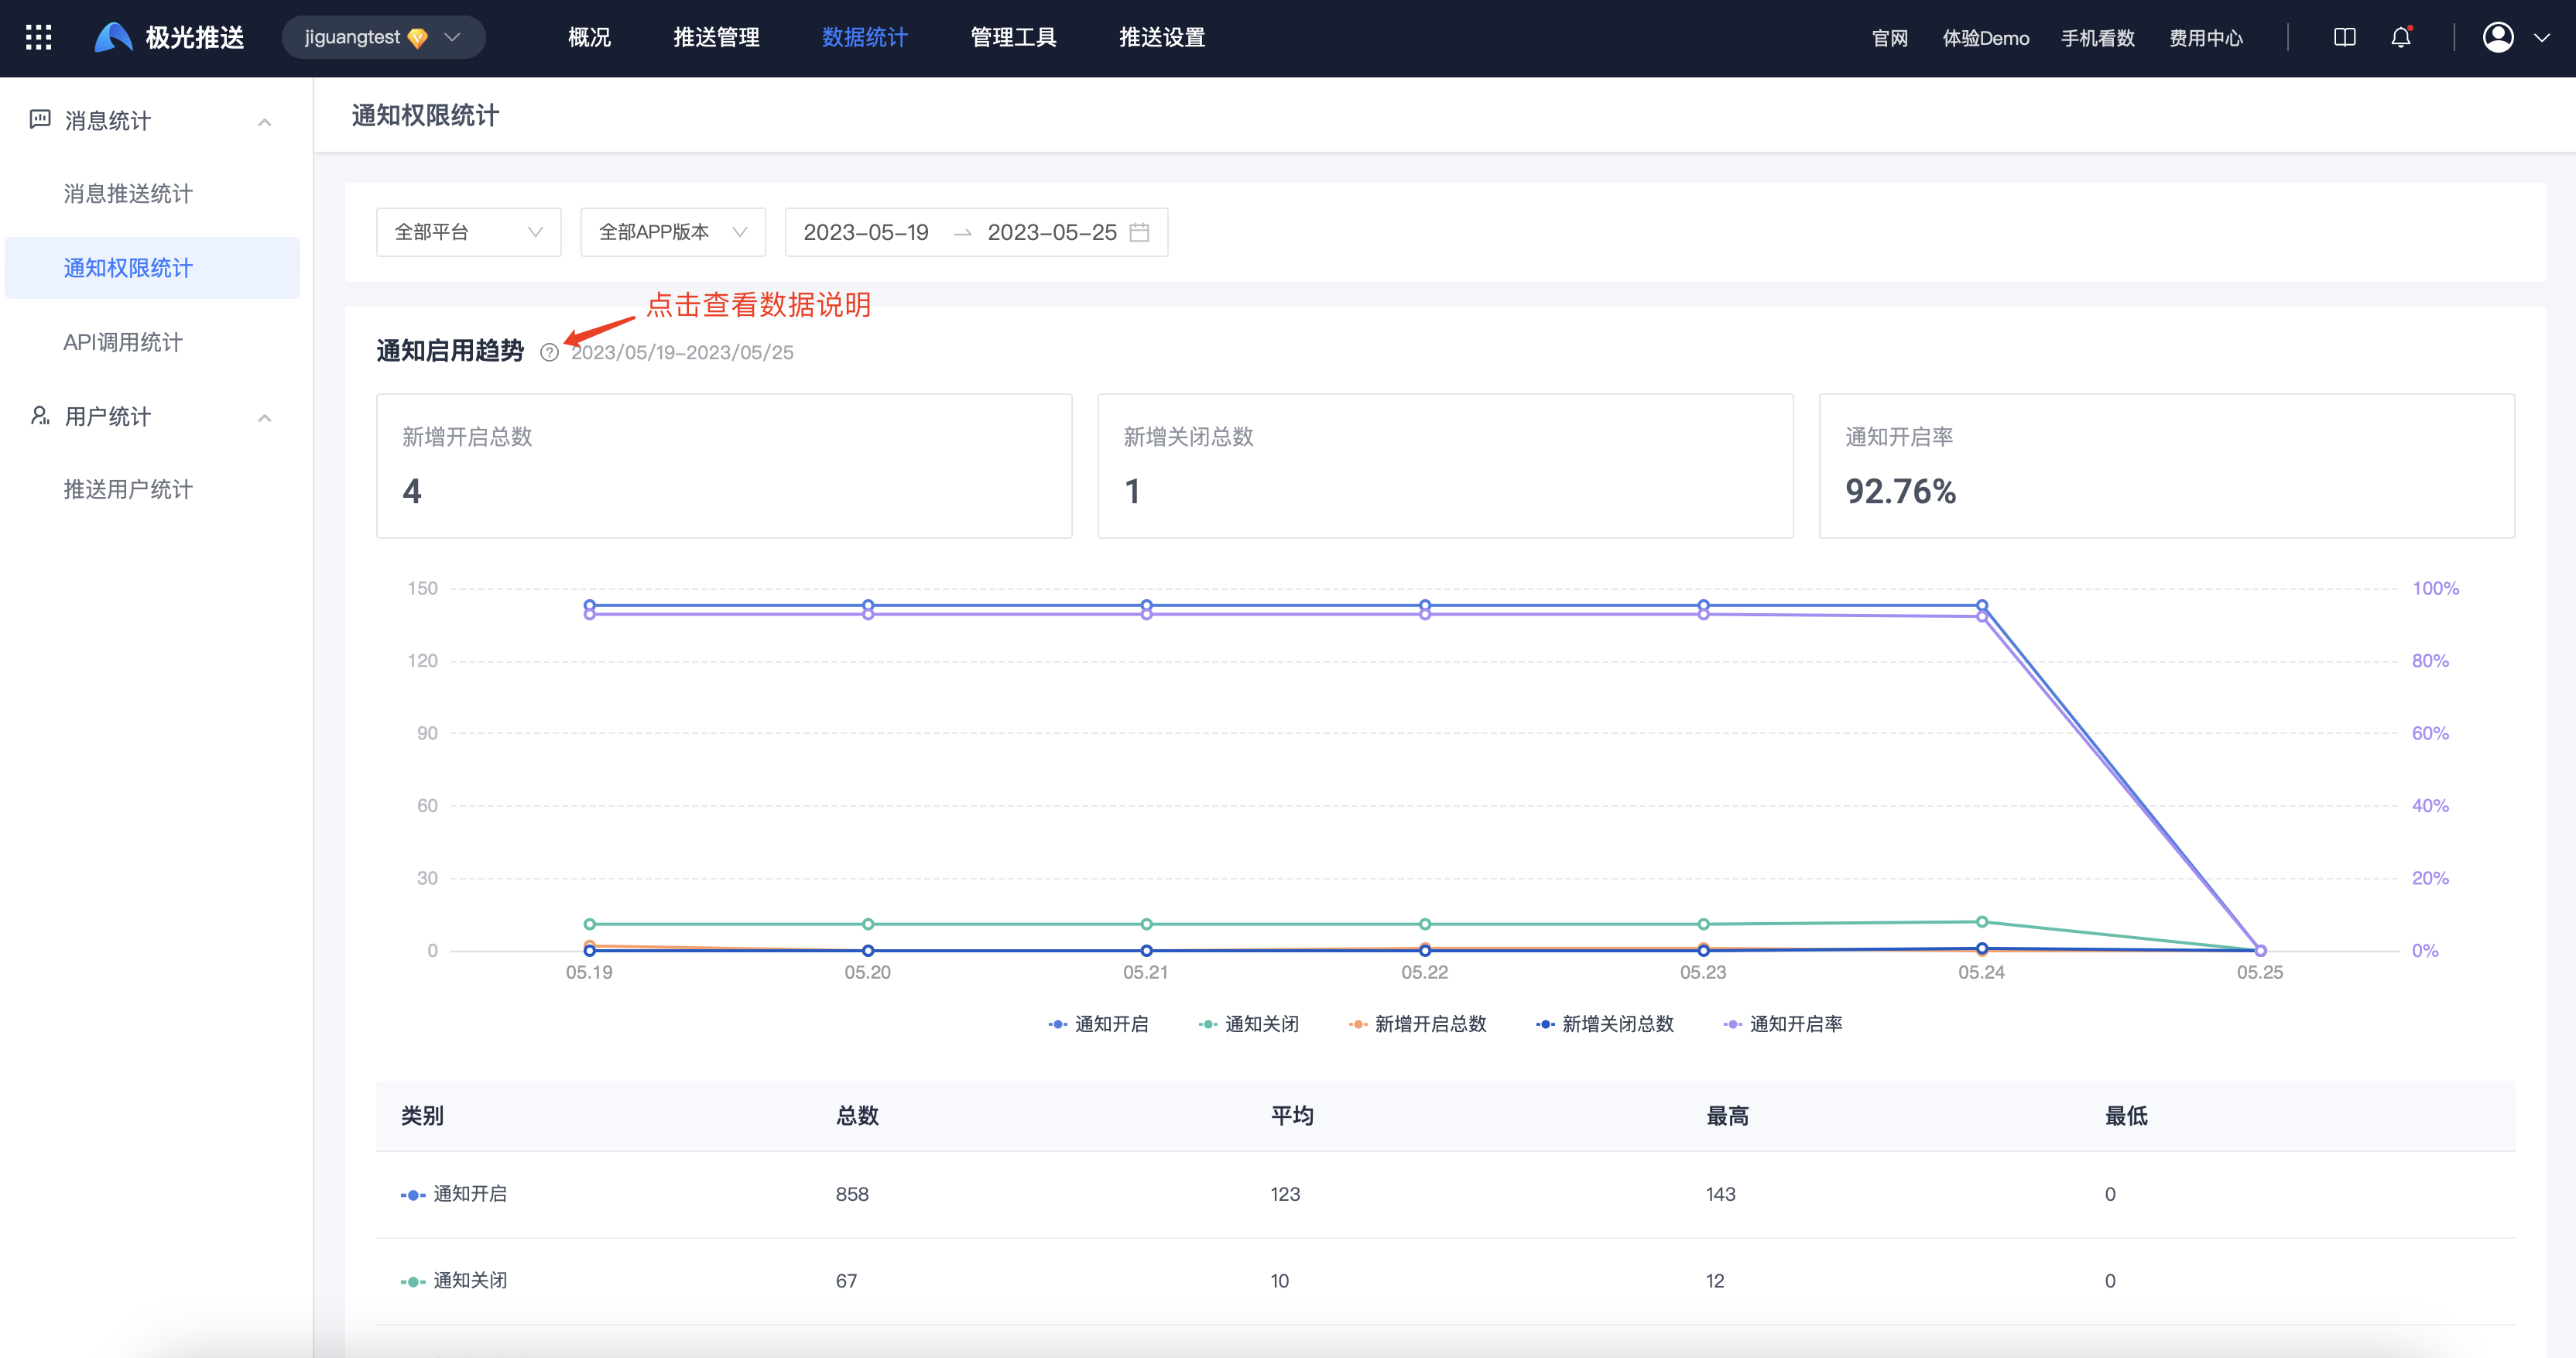
Notification permission statistics
Enter the [Message Push]-[Statistical Analysis]-[Push Statistics]-[Notification Permission Statistics] page to view notification activation trends and detailed data within the selected period.
- Notifications turned on: The total number of users whose notification permission status of this application is turned on.
- Notifications turned off: The total number of users whose notification permission status of this application is turned off.
- Newly enabled: New users who enable the notification permission of this application.
- Newly closed: New users who have closed the notification permission of this application.
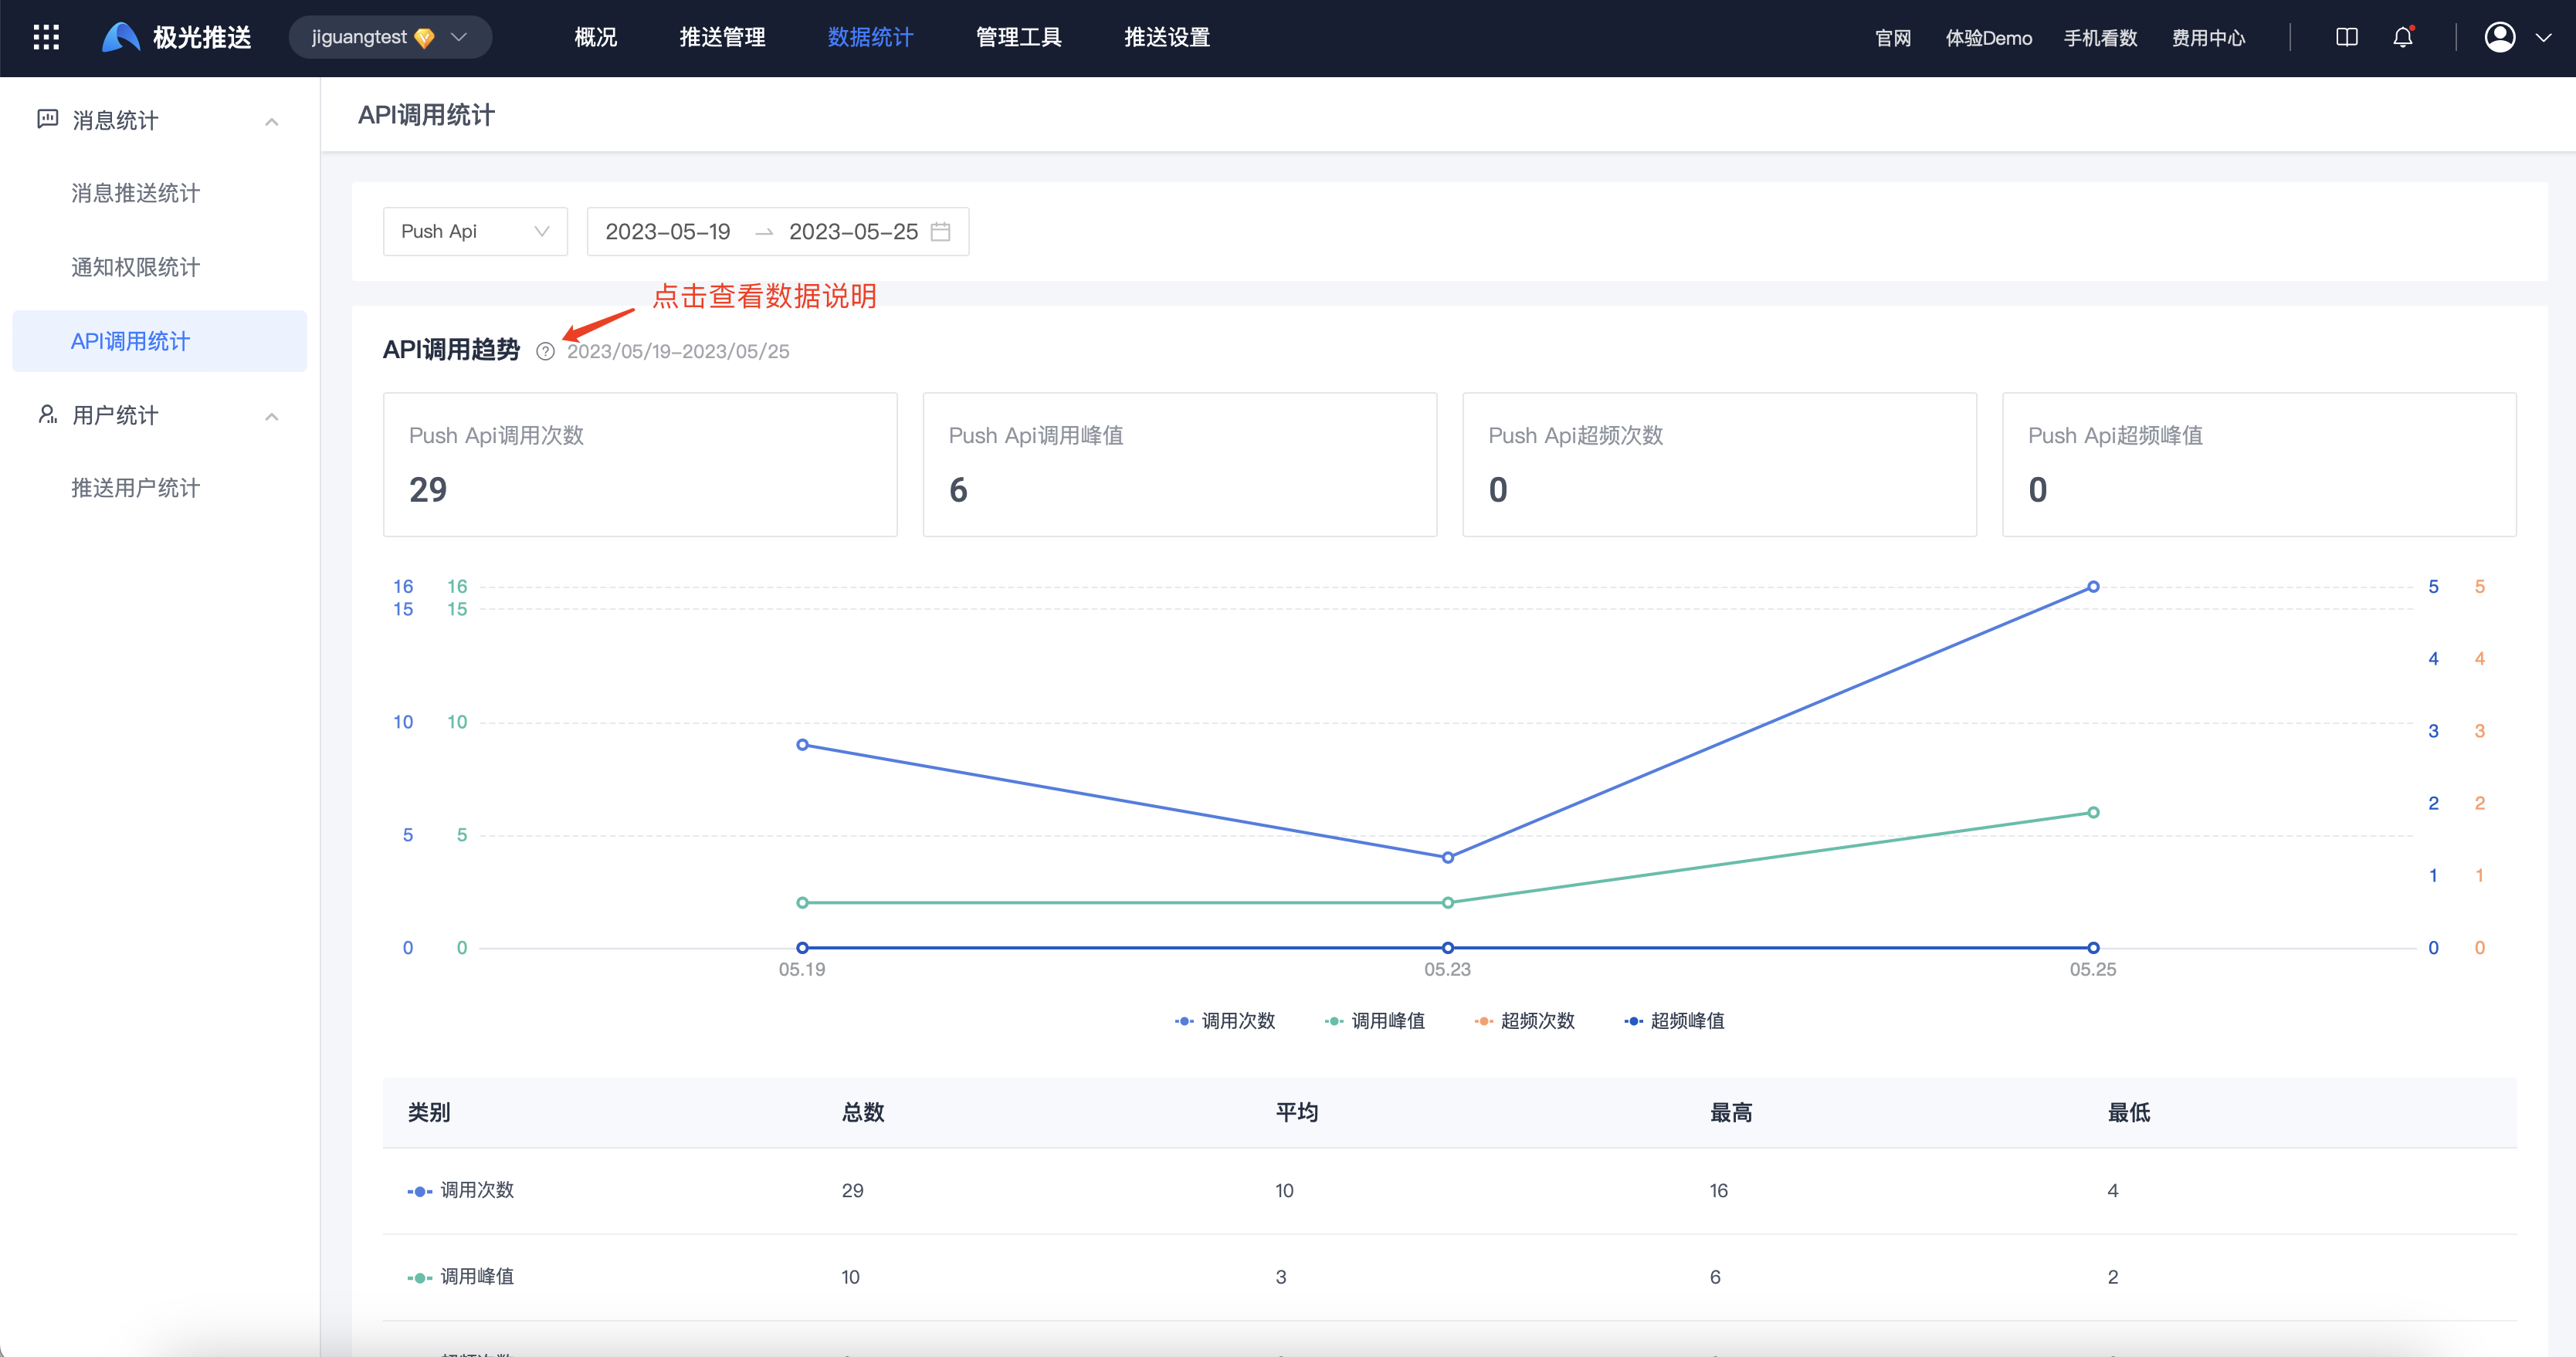
API call statistics
Enter the [Message Push]-[Statistical Analysis]-[Push Statistics]-[API Call Statistics] page to view API call trends and detailed data within the selected period.
- Number of API calls: the total number of calls to the Push API within the statistical period.
- The number of API calls is different from the number of messages. One broadcast push and one alias push are both one API call.